
Forex Pattern Trading is a strategic approach that traders use to identify recurring formations in price charts, which help predict future market movements. By recognizing these patterns, traders can make more informed decisions, manage risks effectively, and increase their chances of profitable trades in the fast-paced forex market.
What is Forex Pattern Trading?
- Forex pattern trading is a method of analyzing market price movement by identifying repeated structures on candlestick charts.
- Instead of depending completely on indicators such as RSI or MACD, traders study price itself—how candles move, how momentum changes, and how buyers and sellers react around support and resistance.
- These repeated shapes are called chart patterns.
- They help traders forecast future movement, plan entries, place stop-loss orders, and calculate take-profit targets with probability, not guesswork.
- For beginners, pattern trading is appealing because every pattern tells a story about the market.
- A double top shows buyers failed twice at a key price. A flag pattern shows traders taking profit before pushing higher.
- A head and shoulders pattern shows a slow shift from bullish momentum to bearish pressure. Understanding these psychological shifts helps traders make decisions logically.
- Pattern trading is widely used in Forex because the currency market reacts strongly to market psychology.
- Central bank news, liquidity zones, and institutional orders often produce clear structural patterns.
- Unlike random price movement, these patterns appear again and again over time—on EUR/USD, GBP/JPY, gold, crypto, even stocks.
- That’s why Trading View, Baby pips, and Investopedia list chart patterns among core foundations of technical analysis.
- Forex pattern trading does not guarantee profit—no strategy does.
- But when combined with confirmation signals, strict risk management, and back testing, it becomes a structured, repeatable method of trading that reduces emotional decisions and improves discipline.
How Forex Pattern Trading Works
- Forex pattern trading works by interpreting the “language” of price.
- Charts show where big institutions enter and exit, where retail traders panic, and where buyers or sellers are waiting for better prices.
- When price repeatedly reacts at similar zones, patterns form—double bottoms, triangles, wedges, flags.
- These formations indicate whether the market is preparing to continue the trend, reverse direction, or consolidate before a breakout.
- Unlike lagging indicators, patterns are based on real-time price data. For example, indicators may show a buy signal after momentum is already gone, but a breakout pattern shows an opportunity at the exact moment demand increases.
- That is why many professional price-action traders prefer pure chart analysis: fewer delays, fewer false signals, and clearer structure.
Patterns work best when combined with:
- Support and resistance
- Trend direction
- Volume behavior
- Candlestick confirmations
- Risk management
Most importantly, pattern trading provides a rule-based system. Instead of guessing when to buy, traders wait for completion, breakout, and confirmation. Probability increases when decisions follow a checklist rather than emotion.
What Are Price Patterns in Forex?

Price patterns are visual formations that appear on candlestick charts when market psychology repeats. Humans react predictably to fear, greed, and uncertainty, and these reactions are visible in price movement. For example:
- When price rises quickly and traders take profit → flags and pennants form
- When buyers are exhausted at resistance → double top forms
- When sellers are losing strength → falling wedge forms
- When both sides are unsure → symmetrical triangle forms
- The reason patterns repeat is because liquidity in the Forex market behaves in cycles.
- Banks, hedge funds, and institutions often place orders at obvious price zones. Retail traders follow these movements, creating clear structures on charts.
- Patterns are divided into reversal, continuation, and consolidation setups. They can appear in trends or in ranges.
- A beginner might think patterns are random drawings, but professionals see patterns as the result of order flow.
- When smart money accumulates or distributes positions, price leaves footprints—and patterns show those footprints clearly.
Why Traders Use Chart Patterns
There are three main reasons traders rely on chart patterns:
Clear Entry and Exit Rules
- A breakout gives a logical entry.
- A previous swing gives a logical stop-loss.
- A measured move gives a logical take-profit.
Example:
In a bullish flag, price breaks the flag resistance. A trader enters on breakout or retest, places stop-loss below the flag, and targets the length of the previous impulse leg.
Psychological Meaning
Patterns reflect what institutions and retail traders are doing:
- Accumulation
- Distribution
- Exhaustion
- Trend continuation
- False breakouts
- Liquidity traps
Unlike indicators, which only measure math, patterns measure behavior.
Works in All Timeframes
- Scalpers use patterns on M1–M15
- Day traders use M30–H4
- Swing traders use H4–Daily–Weekly
Babypips notes that patterns provide higher accuracy when combined with trend direction. For example, trading bullish patterns in a downtrend gives lower probability.
Professionals trade with the trend, not against it.
The strength of patterns is not perfection. Patterns simply increase probability by showing when the market’s psychology is shifting.
That makes them valuable for traders who want a rule-based system rather than random entries.
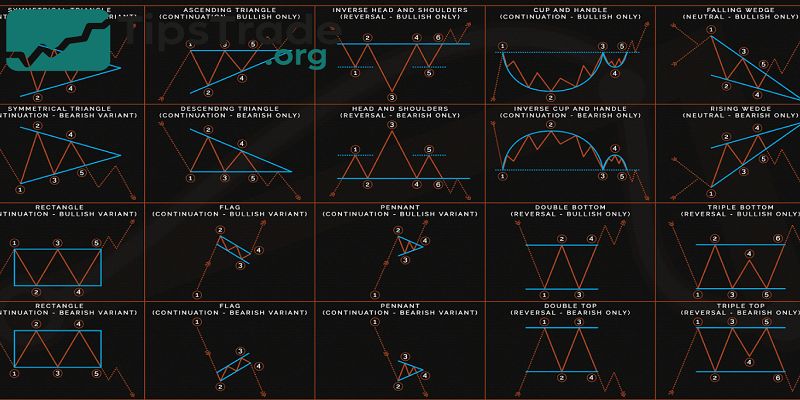
Types of Forex Patterns — Reversal vs Continuation
Forex patterns fall into two main categories:
Reversal Patterns
These signal that the existing trend may be ending.
Examples:
- Head and shoulders (bullish → bearish reversal)
- Inverse head and shoulders (bearish → bullish reversal)
- Double bottom
- Double top
- Falling wedge (bullish reversal)
- Rising wedge (bearish reversal)
Reversal patterns typically form after extended trends. They give traders a chance to enter early at the beginning of a new trend. However, confirmation is essential. Many failed reversal attempts can trap inexperienced traders.
Continuation Patterns
These show the current trend will likely continue after a pause.
Examples:
- Flags
- Pennants
- Rectangles
- Ascending triangles
- Symmetrical triangles
Institutional traders often enter continuation patterns because they follow market momentum. These patterns also provide controlled stop-loss placement because the breakout is usually clean and quick when volume appears.
Why this classification matters
- Reversal trades often offer bigger profit because the trend changes direction.
- Continuation trades often have higher probability because they follow the existing trend.
- Smart traders choose patterns that match market conditions.
- When the trend is strong, continuation patterns are safer.
- When the trend is exhausted, reversal patterns show early opportunity.
Most Popular Forex Chart Patterns (Explained Simply)
Head and Shoulders & Inverse Head and Shoulders
- The head and shoulders pattern is considered one of the most reliable trend-reversal formations.
- It appears after a bullish trend. Price creates a peak (left shoulder), a higher peak (head), and a lower peak (right shoulder).
- When price breaks the neckline, bearish pressure takes control.
Example in real markets:
- On the GBP/USD H4 chart, traders often see a head and shoulders after a strong rally.
- When the neckline breaks, price usually retests before falling. Many traders enter on the retest because it reduces false breakout risk.
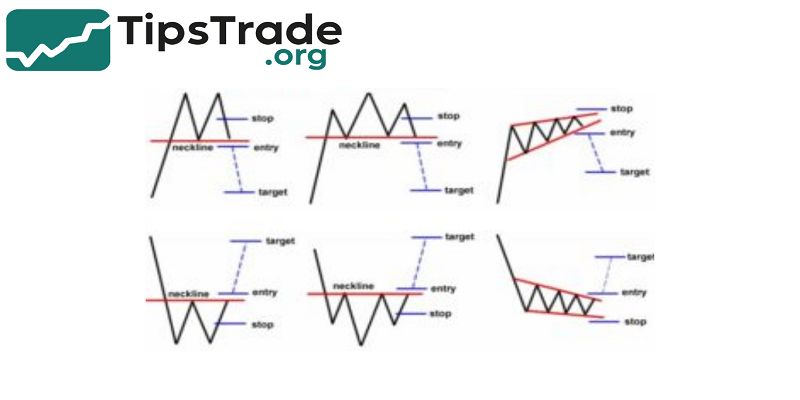
Trading rules:
- Entry: Break or retest of neckline
- Stop-loss: Above right shoulder
- Take-profit: Equal to distance from head to neckline
The inverse pattern works the same but in the opposite direction. A common scenario appears after news events—market dumps, forms inverse head and shoulders, then reverses sharply.
Mistakes beginners make:
- Entering before neckline breaks
- Trading uneven shoulders where pattern is unclear
- Ignoring market trend and volume
Professional traders use volume confirmation. If volume increases during breakout, probability improves. This rule is mentioned by Investopedia and TradingView educational resources, and is widely accepted among technical traders.
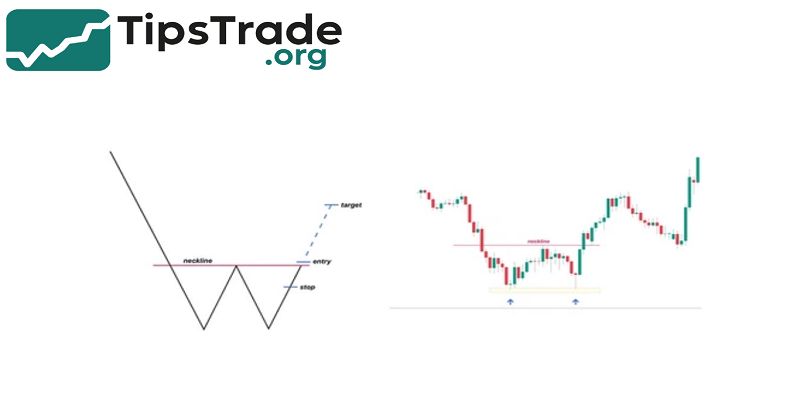
Double Top & Double Bottom
- Double tops and double bottoms are simple yet powerful.
- A double top forms when price touches resistance twice and cannot break through.
- This shows buyers are losing strength.
- When price breaks the neckline, sellers may take control.
Example:
EUR/USD commonly forms double tops around psychological levels like 1.1000 or 1.1200. Many banks place orders at round numbers, making these levels strong reversal points.
Double bottom is the opposite. Price tests support twice without breaking lower. When the neckline breaks, bullish reversal begins.
Trading rules:
- Enter at neckline breakout or retest
- Stop-loss below last swing low (for double bottom)
- Take-profit equals distance from neckline to swing
Pros:
- Easy to identify
- Logical stop-loss placement
- Works best near key levels
Cons:
- Many fake second tops in volatile sessions
- Requires patience; pattern takes time to form
Experienced traders avoid entering early. They wait for a confirmed break instead of guessing.
Triangle Patterns
Triangles form when price compresses into tighter ranges. The market is preparing for a breakout.
Ascending Triangle
- Flat resistance
- Higher lows
- Usually bullish continuation
This pattern shows buyers applying pressure. When resistance breaks, momentum often increases sharply.
Descending Triangle
- Flat support
- Lower highs
- Usually bearish continuation
Sellers push prices downward until support breaks. After breakout, price often accelerates.
Symmetrical Triangle
- Lower highs and higher lows
- Direction unknown — breakout decides the trend
Scalpers like symmetrical triangles on M15 during news sessions, while swing traders use them on H4 or Daily.
How experts trade triangles:
- Entry on breakout + candle close
- Retest increases probability
- Stop-loss outside opposite side
- Target measured from widest part of triangle
False breakouts are common. Volume and retests help filter low-quality signals.
Flags and Pennants
These patterns appear after explosive moves. Institutions take profits, price consolidates, and trend continues.
- Flag → parallel price channel
- Pennant → small triangle after an impulse move
Example: After strong USD/JPY rallies caused by interest-rate announcements, a flag often forms. When breakout continues, price follows trend with momentum.
How traders use flags:
- Enter on breakout
- Stop-loss below flag
- Take-profit equals impulse length
Flags are high-probability continuation setups during major news weeks, especially on gold (XAU/USD) and indices (S&P 500, NASDAQ). The pattern is widely taught in Babypips and TradingView academy content.
Wedges (Rising & Falling Wedge)
Wedges show momentum fading. In a rising wedge, price moves upward but slowly, showing weak buying pressure. In a falling wedge, price declines but sellers lose strength.
Rising wedge → bearish reversal
Falling wedge → bullish reversal
Example:
A falling wedge often forms at the end of bearish swings on AUD/USD or NZD/USD. When breakout happens with strong green candles, price may reverse aggressively.
Best way to trade wedges:
- Wait for breakout
- Use stop-loss outside wedge
- Confirm with RSI divergence or volume
Beginners frequently confuse channels with wedges. A true wedge has narrowing structure—highs and lows become tighter.
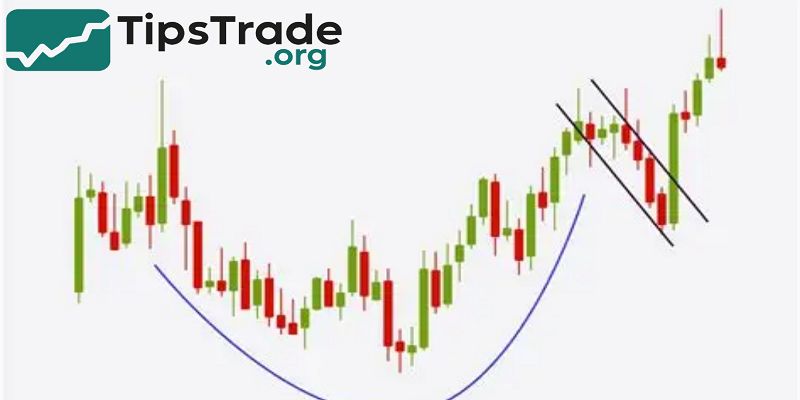
Cup and Handle
- Cup and handle is a bullish continuation pattern.
- It forms when price drops slowly, bottoms, then rises again creating a U-shaped structure.
- The handle is a small retracement before a breakout.
Example:
GBP/USD might form a cup and handle before breaking through a strong psychological level like 1.3000. The handle “shakes out” weak buyers before big institutions push price upward.
Notable points:
- Works best in trending markets
- Requires patience — pattern may take days or weeks
- Breakout tends to be strong if volume increases
Cup and handle is commonly used in stocks but also applies to Forex and crypto because accumulation behavior is similar across markets.
Candlestick Patterns Used in Forex Pattern Trading
Bullish Reversal Patterns
Bullish candlestick patterns help traders confirm entries after a downtrend.
Hammer
A hammer has a small body and long lower wick. It shows sellers pushed the price lower, but buyers pulled it back. Strong on support levels.
Morning Star
Three-candle pattern:
- Bearish candle
- Small indecision candle
- Strong bullish candle closing above midpoint
- This shows momentum shift.
Bullish Engulfing
The bullish candle fully covers the previous bearish candle. Indicates aggressive buying.
Real example:
On USD/CAD H1, a bullish engulfing after oil news sometimes reverses intraday trend. Traders confirm with support zones or trendlines.
These patterns improve accuracy when:
- They occur near strong support
- Volume increases
- Price confirms with higher high
Bearish Reversal Patterns
Bearish candlestick patterns confirm downtrends after bullish rallies.
Shooting Star
Long upper wick shows buyers tried to break higher but failed.
Evening Star
Opposite of morning star:
- Strong bullish candle
- Small candle
- Strong bearish candle breaking lower
Bearish Engulfing
Bearish candle engulfs previous bullish candle. Shows aggressive selling.
Stop-loss rules:
- Above pattern high (safer for retest)
- Close to structure edges reduces risk
Neutral & Indecision Patterns
Neutral patterns show uncertainty.
Doji
- Open and close nearly equal → balance of power
- Often signals upcoming reversal if found at strong levels
Spinning Top
- Small body, upper and lower wicks → indecision
- Not a signal by itself — needs confirmation
These patterns warn traders not to jump into trades blindly. Many beginners ignore doji candles during top or bottom formation, leading to premature entries.
Price-action educators including Nial Fuller and Steve Nison emphasize that doji signals should only matter when combined with context: trend exhaustion, support, resistance, or confluence.
How to Trade Forex Patterns Step-by-Step
Step 1 — Identify the Pattern
Identification requires patience. Many new traders force patterns where they do not exist. A valid pattern has:
- Clear structure
- Clean highs and lows
- Logical breakout point
Traders should avoid drawing trendlines based on random candles. Using swing highs and swing lows keeps patterns accurate. Higher timeframes increase clarity and reduce fake shapes.
For confirmation, traders can zoom out to see the bigger trend. Pattern trading is not only about shapes—it’s about structure, liquidity, and trend direction.
Step 2 — Confirm the Signal
Confirmation improves probability. Traders often combine:
- Support and resistance
- RSI divergence
- MACD momentum shift
- Volume expansion
- Breakout candle close above/below structure
Example:
- A rising wedge may show bearish reversal, but entering before breakout is dangerous.
- Professionals wait for candle close below wedge support. If volume increases or RSI confirms, probability improves.
Beginners often trade early because they fear missing out (FOMO). This increases losses. Pattern trading rewards patience and discipline.
Step 3 — Plan Entry, Stop-Loss, Take-Profit
A major benefit of pattern trading is clear risk management.
Stop-loss always goes at logical structure:
- Above pattern high (for bearish setups)
- Below pattern low (for bullish setups)
Never “guess” stop-loss.
Take-profit often uses:
- Measured move method
- Next support/resistance
- Fixed risk-reward (1:2 or 1:3)
Example:
- In head and shoulders, the target equals distance from head to neckline.
- This method is taught on Investopedia and is widely used by technical traders.
- A pattern with poor risk/reward should be avoided.
- Probability is meaningless if reward is small and risk is large.
Step 4 — Manage Risk and Position Size
Risk management decides whether a trader survives long-term. Even perfect patterns fail sometimes. No pattern has 100% success.
Professional traders:
- Risk 1–2% per trad
- Do not over-leverage
- Use stop-loss always
- Avoid revenge trading
TradingView statistics show beginners blow accounts not because they lack good strategies, but because they risk too large or ignore stop-loss.
A trader with 40% win rate but solid risk/reward can be profitable. A trader with 80% win rate but poor risk control still loses money.
Pattern trading is not magic—it is probability management.
Real Chart Examples and Case Studies
Winning Trade — EUR/USD Bullish Flag
On EUR/USD H1, price rallied after ECB interest rate comments. Price created a bullish flag. When price broke the flag resistance with a strong bullish candle, traders entered.
- Stop-loss below flag
- Target equal to previous impulse
Trade hit the target because momentum continued.
Reason for success: trend + momentum + structure + breakout confirmation.
Losing Trade — GBP/JPY Double Top
On GBP/JPY M15, price formed a double top. The trader entered early before the neckline broke. Market reversed and continued uptrend.
Reason for failure:
- No neckline break
- Entered too early
- No confirmation
Lesson: patterns must be completed before trading.
Experienced traders share losing examples to promote transparency and trustworthiness. This avoids unrealistic expectations.
Advantages & Limitations of Forex Pattern Trading

Pros
- Works on all timeframes and markets
- Clear entry, stop-loss, and target
- No need for many indicators
- Strong psychological foundation
- Helps avoid emotional trading
Pattern trading is ideal for traders who want a structured system. It fits scalpers, day traders, and swing traders. Price action remains effective even during high-volatility events when indicators lag.
Cons
- Many fake breakouts
- Requires patience and discipline
- Some patterns take days or weeks
- Not suitable in extremely choppy markets
Pattern trading is not easy. Many traders lose because they draw patterns incorrectly or enter too early. Using confirmation tools such as volume, zones, and retests filters low-probability setups.
No pattern guarantees success. Risk management determines long-term survival.
Conclusion
Forex pattern trading is a powerful, structured method of analyzing the market. It teaches traders to understand price behavior instead of relying on delayed signals. Patterns help identify entries, stop-loss placement, and profit targets with logic and probability rather than emotion. When combined with confirmation tools, backtesting, and risk management, pattern trading becomes a reliable way to trade Forex professionally. Through this article, tipstrade.org wish you luck and success on your trading journey. Hopefully, the in-depth analysis of Stock Market Trends will help you make smart and profitable investment decisions.