
The Evening Star candlestick is one of the most commonly used multi-candlestick patterns in technical analysis due to its strong reversal signals. However, many investors still do not fully understand how to identify this pattern on price charts or how to apply it effectively in trading. Therefore, let’s join Tipstrade.org in exploring the most fundamental information about the Evening Star candlestick through this article.
What is an Evening Star candlestick?
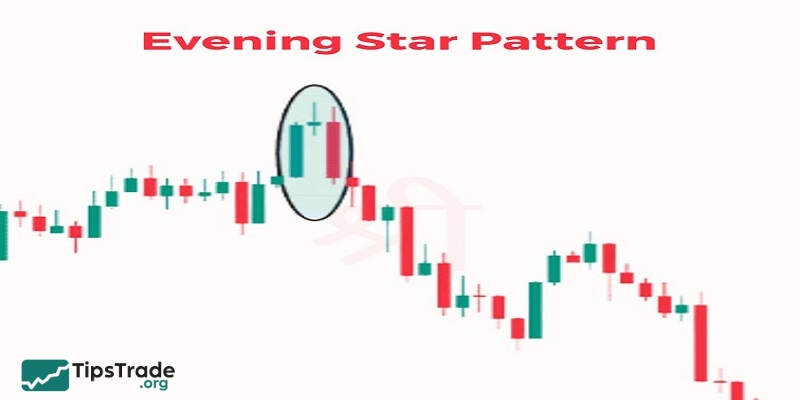
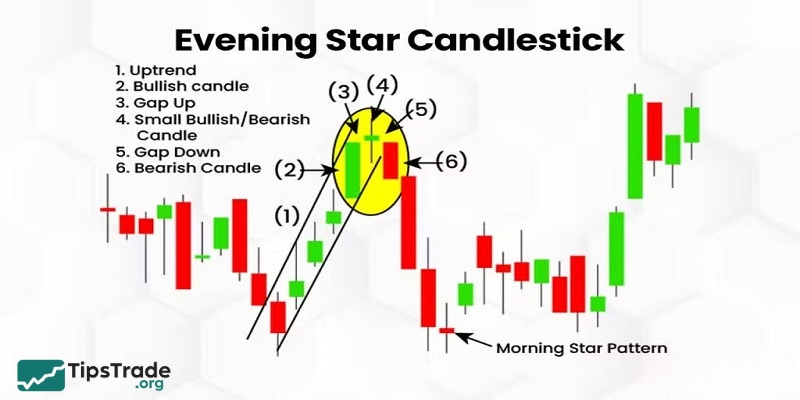
The Evening Star candlestick pattern is a Japanese candlestick formation consisting of three candles that appears at the top of an uptrend, signaling a potential reversal to a downtrend. The pattern is named after the image of a star appearing in the evening, symbolizing the end of “light” (the uptrend) and the transition into “darkness” (the downtrend).
See more:
- What Is a Morning Star Candlestick & How to Trade It
- How to Trade with the Piercing Candlestick Pattern Effectively
- How to Use the Hammer Candlestick for the Most Effective Trading
- Shooting Star Candlestick Pattern: How to Identify and Trade It Effectively
Structure of the Evening Star candlestick
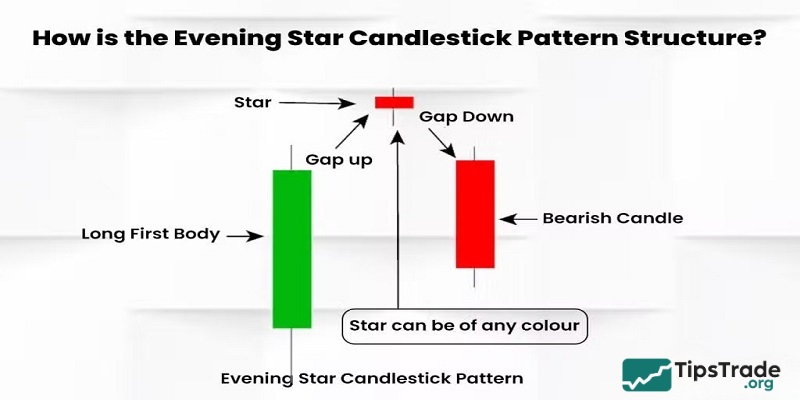
To accurately identify the Evening Star pattern, you need to pay attention to three candles with the following specific characteristics:
Candle 1: Strong bullish candle
- This is a long bullish candle, reflecting strong buying pressure within an uptrend.
- The candle body is usually large with short wicks, indicating that buyers are firmly in control of the market.
Candle 2: Doji or Small-bodied candle (Star candle)
- This candle has a very small body and can be a Doji (where the opening and closing prices are nearly equal) or a Spinning Top.
- It appears at a high price level, signaling market indecision, where buying and selling forces begin to balance.
- A price gap between Candle 1 and Candle 2 often appears in the stock market; however, in the forex market, this gap is not mandatory.
Candle 3: Strong bearish candle
- This is a long bearish candle that confirms the trend reversal.
- The candle body is large with short wicks, showing that sellers have gained dominance and pushed prices lower.
How useful is Evening Star candlestick?
The Evening Star candlestick pattern reflects a shift in market psychology:
- Candle 1: Buyers push prices higher, demonstrating strong optimism.
- Candle 2: The market begins to stall, with hesitation emerging as buying momentum gradually weakens.
- Candle 3: Sellers enter aggressively, overpower buyers and driving prices lower, signaling that the uptrend has come to an end.
This pattern is considered highly reliable, especially when it appears at key resistance levels or after a prolonged uptrend.
How to identify the Evening Star candlestick accurately
To ensure the reliability of the Evening Star pattern, traders should pay attention to the following factors:
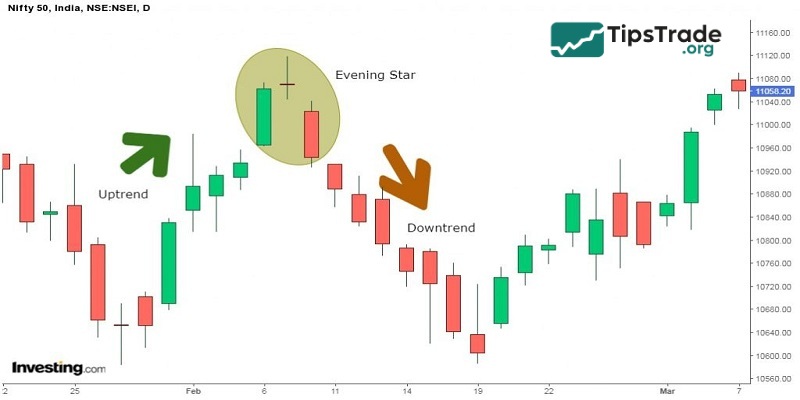
- Prior trend: The pattern is only meaningful when it appears after a clear uptrend. If the market is moving sideways, the signal may be unreliable.
- Location: The Evening Star pattern is strongest when it forms near resistance levels, Fibonacci retracement zones, or other key price levels.
- Trading volume: If the third candle is accompanied by high trading volume, it further strengthens the reversal signal.
- Confirmation from technical indicators: Use indicators such as RSI, MACD, or moving averages (MA) to confirm the signal. For example, if the RSI indicates that the market is overbought, the likelihood of a reversal increases.
Effective trading strategies using the Evening Star candlestick
Below are specific trading strategies that combine the Evening Star candlestick with technical analysis tools to optimize profits and minimize risk.
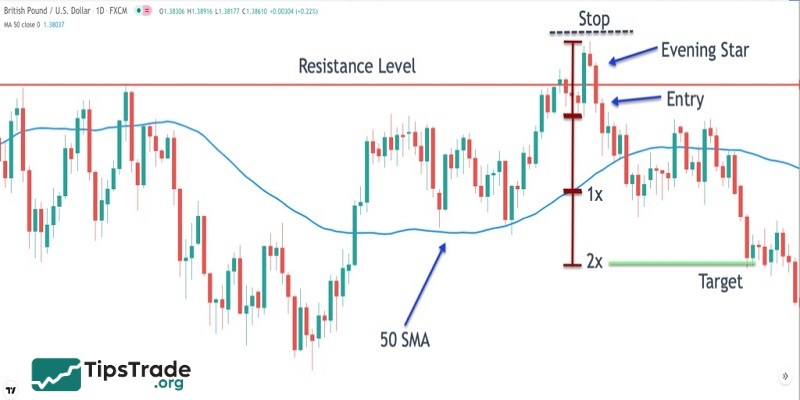
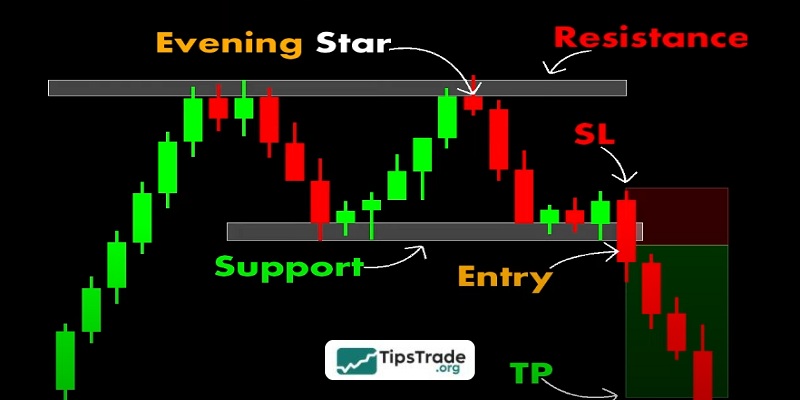
Strategy 1: Trading with resistance levels
Step 1: Identify resistance levels
- Use drawing tools to mark resistance zones or Fibonacci levels.
- Make sure the Evening Star candlestick forms near these areas.
Step 2: Wait for confirmation
- Wait for the third candle to close to confirm that the pattern is complete.
- Check indicators such as RSI or MACD to ensure that bullish momentum is weakening.
Step 3: Enter the trade
- Place a sell order immediately after the third candle closes.
- Stop loss: Set above the high of the second candle (the Doji candle) to protect against price reversals.
- Take profit: Calculate based on a Risk–Reward (R:R) ratio of at least 1:2, or target the nearest support level.
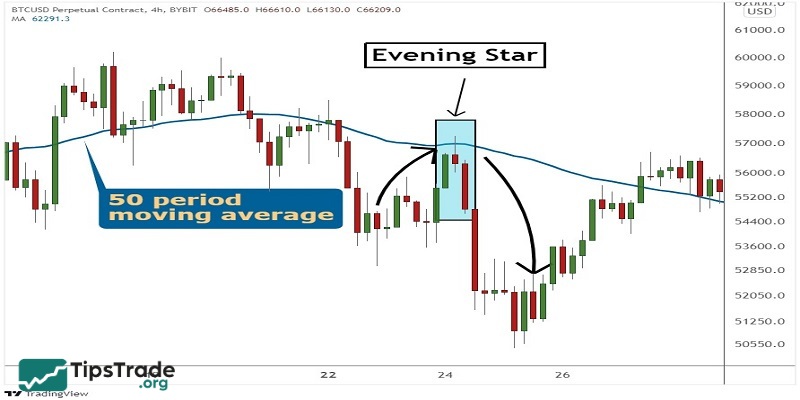
Strategy 2: Combining with Moving Averages (MA)
Step 1: Set up Moving Averages line
- Use two moving averages, such as MA50 and MA200, on the H1 or H4 timeframe.
- Ensure that price is trading above both moving averages, confirming an uptrend.
Step 2: Identify the Evening Star candlestick
- Observe the Evening Star candlestick forming when price touches or moves above the MA50.
- Wait for the third candle to break below the MA50 to confirm the trend reversal.
Step 3: Execute the trade
- Enter a sell position when price breaks below the MA50.
- Stop loss: Place above the high of the Evening Star pattern.
- Take profit: Target the MA200 level or the nearest support zone.
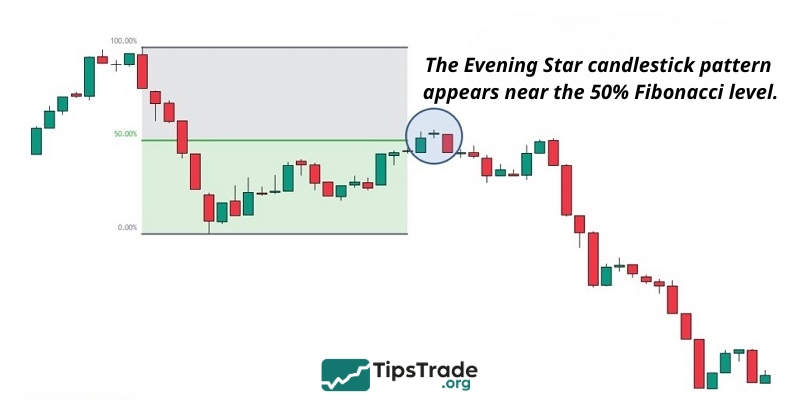
Strategy 3: Trading with Fibonacci Retracement
Step 1: Draw Fibonacci levels
- Identify the prior uptrend and draw the Fibonacci retracement from the swing low to the swing high.
- Look for the Evening Star candlestick forming near the 50%, 61.8%, or 78.6% Fibonacci levels.
Step 2: Confirm the signal
- Check whether the third candle breaks below the Fibonacci level.
- Use the Stochastic indicator to confirm overbought conditions.
Step 3: Enter the trade
- Sell when price breaks the Fibonacci level and the third candle closes.
- Stop loss: Place above the next Fibonacci level.
- Take profit: Target the 38.2% Fibonacci level or lower.
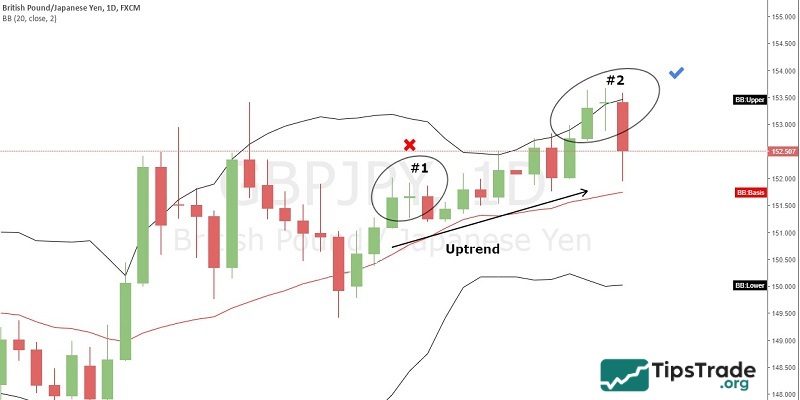
Strategy 4: Combining with Bollinger Bands
Step 1: Set up Bollinger Bands
- Apply the Bollinger Bands indicator with standard settings (20 periods, 2 standard deviations) on the H4 or D1 timeframe.
- Observe price touching or breaking above the upper band, indicating that the market is in an overbought condition.
Step 2: Identify the Evening Star candlestick
- Look for the Evening Star candlestick pattern forming as price touches the upper band and begins to reverse.
- Wait for the third candle to close below the middle line of the Bollinger Bands (SMA20) to confirm the bearish signal.
Step 3: Execute the trade
- Enter a sell order when the third candle closes below the SMA20.
- Stop loss: Place above the high of the second candle or above the upper Bollinger Band.
- Take profit: Target the lower Bollinger Band or the nearest support level.
Note: This strategy works well in highly volatile markets, but traders should be cautious when the Bollinger Bands contract, as this often signals a sideways market.
Strategy 5: Combining with price chart patterns
Step 1: Identify supporting price patterns
- Look for other price patterns such as a Double Top or Head and Shoulders forming at the same time as the Evening Star candlestick pattern.
- Ensure that the Evening Star candlestick appears at the second peak of a Double Top or at the right shoulder of a Head and Shoulders pattern.
Step 2: Confirm the signal
- Use the ADX indicator to confirm that the bearish trend is strengthening (ADX above 25).
Step 3: Enter the trade
- Place a sell order when price breaks below the neckline.
- Stop loss: Set above the high of the Evening Star pattern, the high of the price pattern, or just above the candle that breaks the neckline.
- Take profit: Calculate based on the height of the price pattern (the distance from the peak to the neckline) or target the nearest support level.
Note: This strategy requires patience to wait for confirmation from both patterns, but it offers high accuracy during strong trend reversals.
Strategy 6: Combining with Volume Profile
Step 1: Use Volume Profile
- Apply the Volume Profile indicator to identify price levels with high trading volume (High Volume Nodes – HVN) and low trading volume (Low Volume Nodes – LVN).
- Look for the Evening Star candlestick forming near an HVN area, where price often encounters strong resistance.
Step 2: Confirm the signal
- Wait for the third candle to close below the HVN zone, indicating price rejection and that sellers are gaining control.
- Check whether the trading volume of the third candle spikes to further strengthen the signal.
Step 3: Execute the trade
- Enter a sell order when price breaks below the HVN area.
- Stop loss: Place above the high of the Evening Star candlestick or above the HVN zone.
- Take profit: Target the nearest LVN area, where price may find support.
Important notes when trading with the Evening Star candlestick
- Avoid blind trading: Always combine the pattern with other tools such as support/resistance levels and technical indicators.
- Risk management: Risk no more than 1–2% of your account per trade to protect your capital.
- Timeframes: The Evening Star candlestick works best on higher timeframes such as H4 and D1, but it can also be applied on H1 or M15 for short-term and scalping trades.
- Avoid major news events: The Evening Star candlestick candlestick may produce false signals if it appears ahead of major economic events such as Non-Farm Payrolls or interest rate decisions.
- Practice on a demo account: Before applying the strategy on a live account, test it on a demo account to become familiar with identifying and trading the Evening Star candlestick pattern.

Compare the Evening Star and Morning Star candlestick
|
Criteria |
Evening Star |
Morning Star |
|
Meaning |
Signals a reversal from an uptrend to a downtrend (bearish reversal). |
Signals a reversal from a downtrend to an uptrend (bullish reversal). |
|
Prior trend |
Uptrend. |
Downtrend. |
|
Structure (3 candles) |
1. Strong bullish candle (long).
2. Small-bodied candle (Doji or Spinning Top) with a narrow price range. 3. Strong bearish candle (long). |
1. Strong bearish candle (long).
2. Small-bodied candle (Doji or Spinning Top) with a narrow price range. 3. Strong bullish candle (long). |
|
Formation location |
At the top of an uptrend. |
At the bottom of a downtrend. |
|
Signal confirmation |
The third candle closes below 50% of the first candle’s body, accompanied by increased volume. |
The third candle closes above 50% of the first candle’s body, accompanied by increased volume. |
|
Reliability |
High when formed at resistance levels with strong volume. |
High when formed at support levels with strong volume. |
|
Market psychology |
Buying pressure weakens, sellers gain control. |
Selling pressure weakens, buyers gain control. |
Conclusion
The Evening Star candlestick pattern is a powerful tool that helps traders identify potential reversals from an uptrend to a downtrend. With its distinctive three-candle structure, this pattern provides reliable signals when combined with technical analysis tools such as resistance levels, moving averages (MA), Fibonacci retracements, Bollinger Bands, price patterns, or Volume Profile. The trading strategies presented in this article are designed to help you optimize profits and minimize risk.
To succeed, always maintain trading discipline, apply strict risk management, and practice consistently.
See more:
- Three Black Crows Candlestick – What It Is And How To Trade It
- What is a Doji candlestick pattern? Common Doji candlestick patterns in investing
- Three White Soldiers Candlestick Pattern – Opening Profit Opportunities for Investors
- Dark Cloud Cover Candlestick and Profitable Trading Strategies Every Investor Should Know!