
Efficient frontier is a key concept in investment theory that identifies the set of portfolios offering the highest expected return for a given level of risk or the lowest risk for a given return. Understanding the efficient frontier enables investors to optimize their asset allocation effectively by balancing risk and return. Visit tipstrade.org and check out the article below for further information
What Is the Efficient Frontier?
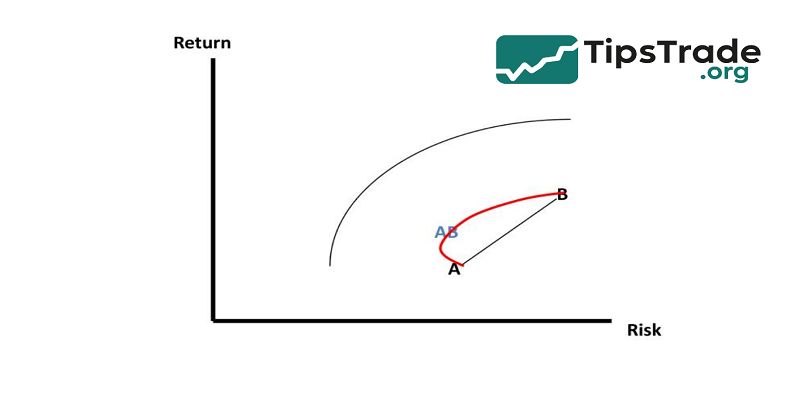
The Efficient Frontier is the graphical representation of all efficient portfolios—combinations of risky assets that maximize return for each risk level. The concept arises from Modern Portfolio Theory (MPT), which assumes investors are risk-averse: they prefer higher returns but dislike volatility.
On a chart, the x-axis typically measures standard deviation (σ), a proxy for risk, while the y-axis measures expected return (E[R]). The Efficient Frontier forms a concave curve that slopes upward:
- Portfolios below the curve are suboptimal—they deliver too little return for their level of risk.
- Portfolios on the curve are efficient.
- Portfolios above the curve are unattainable given the available assets.
Mathematically, for any two assets A and B, the expected return and variance of a portfolio are calculated as:
E[Rp]=wAE[RA]+wBE[RB]E[R_p] = w_A E[R_A] + w_B E[R_B]E[Rp]=wAE[RA]+wBE[RB] σp2=wA2σA2+wB2σB2+2wAwBσAσBρA,Bσ_p^2 = w_A^2 σ_A^2 + w_B^2 σ_B^2 + 2w_A w_B σ_A σ_B ρ_{A,B}σp2=wA2σA2+wB2σB2+2wAwBσAσBρA,B
where ρA,Bρ_{A,B}ρA,B is the correlation between the assets.
By varying the weights wA,wBw_A, w_BwA,wB, one can generate different portfolio combinations and trace the Efficient Frontier.
>>See more:
- What is Industry Comparison and How to do it?
- What are Profitability Ratios? Types & Its Significance
- Key Stock Valuation Ratios and When to Use Which One
- How to Read Financial Statements Like a Pro in Stock Investment
Harry Markowitz and Modern Portfolio Theory
- In 1952, Harry Markowitz published “Portfolio Selection” in The Journal of Finance, laying the foundation of Modern Portfolio Theory (MPT).
- He demonstrated that portfolio risk depends not just on the volatility of individual assets but on how those assets correlate.
- This insight—diversification reduces risk without necessarily reducing returns—earned Markowitz the Nobel Prize in Economic Sciences in 1990.
- His model formalized what intuitive investors had long suspected: owning a mix of assets that do not move perfectly together can improve overall performance.
According to Markowitz’s framework:
- Investors should focus on the entire portfolio’s risk-return characteristics, not single assets.
- An efficient portfolio is one that maximizes expected utility for a given risk tolerance.
- Rational investors will always choose a portfolio on the Efficient Frontier.
Today, MPT underpins much of quantitative finance, from index fund design to robo-advisory algorithms and pension fund optimization.
Constructing the Efficient Frontier: Step-by-Step Process
Define the Investment Universe
- Select the assets to include—e.g., equities, bonds, commodities, or ETFs.
- Each must have historical data for returns, variances, and correlations.
Estimate Inputs
- Expected returns: Often derived from historical averages, CAPM, or analyst forecasts.
- Standard deviations: Measure of each asset’s volatility.
- Correlations: Indicate how assets move relative to each other.
Compute Portfolio Metrics
- Using the formulas above, compute expected return and variance for numerous weight combinations.
- Software like Excel Solver, R, Python (NumPy, PyPortfolioOpt), or MATLAB can generate thousands of portfolios efficiently.
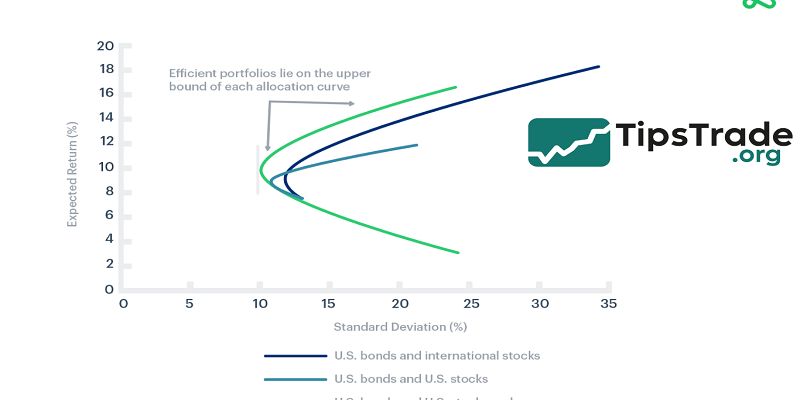
Identify the Efficient Portfolios
Plot all portfolios on the risk–return graph. The upper boundary of the resulting scatter forms the Efficient Frontier.
| Portfolio Type | Risk (σ) | Expected Return (E[R]) | Efficiency |
| A (100% Bonds) | 4% | 3% | Inefficient |
| B (50/50 Mix) | 6% | 6% | Efficient |
| C (80% Stocks) | 10% | 9% | Efficient |
| D (100% Stocks) | 13% | 9.5% | Suboptimal |
(Example data for illustration only.)
Select the Optimal Portfolio
- The choice depends on investor preferences.
- Some may prefer low-volatility portfolios near the left of the curve; others may favor higher-return portfolios near the right.
Adding a Risk-Free Asset: The Capital Market Line (CML)
- When a risk-free asset—like Treasury bills—is introduced, the analysis evolves. Investors can now blend the risk-free asset with risky portfolios.
- The result is the Capital Market Line (CML), which tangentially touches the Efficient Frontier.
- The tangent point represents the tangency portfolio, offering the highest Sharpe Ratio (excess return per unit of risk):
- Sharpe Ratio=E[Rp]−RfσpSharpe\ Ratio = \frac{E[R_p] – R_f}{σ_p}Sharpe Ratio=σpE[Rp]−Rf
- Where RfR_fRf is the risk-free rate.
Any portfolio on the CML is superior to portfolios below it, as it offers better compensation for each unit of risk.
Institutional investors often target this tangency portfolio and adjust their exposure using leverage (to move above the tangency point) or capital allocation (to reduce risk).
The Core of Efficiency
The power of the Efficient Frontier lies in correlation.
- When assets are perfectly correlated (ρ = 1), diversification yields no benefit.
- When assets are negatively correlated, total portfolio volatility drops significantly.
- For example, stocks and bonds often exhibit low or negative correlation during market stress, which helps stabilize portfolios.
- This is why many balanced funds allocate 60% to equities and 40% to bonds—a classic position close to the historical Efficient Frontier (Morningstar, 2023).
- Empirical data from the CFA Institute Research Foundation shows that over long horizons, portfolios diversified across asset classes achieve 15–30% lower volatility without sacrificing returns compared to single-asset portfolios.
Institutional and Retail Use Cases

Institutional Portfolios
- Pension funds, endowments, and sovereign wealth funds rely on mean–variance optimization to construct efficient portfolios.
- Using complex covariance matrices and forward-looking return forecasts, they identify allocations that balance growth with capital preservation.
Wealth Advisors and Robo-Advisors
- Platforms like Betterment, Wealthfront, and Vanguard Digital Advisor use the Efficient Frontier within algorithms that customize portfolios for each client’s risk profile.
Retail Investors
- Even individual investors can use simple tools (Excel Solver or online portfolio optimizers) to visualize their Efficient Frontier and adjust allocations accordingly.
Strengths and Limitations of the Efficient Frontier

Strengths
- Quantifies risk-return trade-offs clearly.
- Promotes diversification, grounded in empirical data.
- Applicable across asset classes—stocks, bonds, alternatives.
- Foundation for modern quantitative investing.
Limitations
- Relies on historical data, which may not predict future returns.
- Assumes normally distributed returns and rational investors.
- Highly sensitive to input errors—small changes in expected returns or correlations can drastically alter the frontier.
- Ignores tail risks and non-linear relationships (addressed in Post-Modern Portfolio Theory).
Despite these weaknesses, the Efficient Frontier remains a cornerstone framework, especially when combined with stress testing and scenario analysis to adjust for real-world dynamics.
Beyond the Basic Frontier
Professional investors often move beyond the static Markowitz model toward enhanced frameworks that address its assumptions.
- Black-Litterman Model: Incorporates investor views into expected returns, producing more stable portfolios.
- Conditional Value at Risk (CVaR) Optimization: Focuses on downside risk instead of variance.
- Monte Carlo Simulations: Model uncertain future returns to map probabilistic frontiers.
- Dynamic Frontier Models: Adjust the efficient set over time as market conditions evolve.
By integrating these advanced tools, portfolio managers align theoretical optimization with real-world adaptability, bridging the gap between finance theory and market practice.
Real-World Example: Comparing Portfolios
Consider two investors:
| Investor | Portfolio Composition | Expected Return | Volatility | Position vs Frontier |
| Alpha Fund | 80% Global Equities, 20% Bonds | 9.0% | 11% | On the Frontier |
| Beta Fund | 100% Equities | 9.3% | 14% | Below Frontier |
| Gamma Fund | 50% Equities, 50% Bonds | 6.2% | 6.5% | On the Frontier |
Although Beta Fund offers slightly higher expected return, its volatility is disproportionately high, placing it below the Efficient Frontier—a suboptimal choice.
Alpha Fund achieves a similar return with lower risk, demonstrating superior efficiency.
How to Find Your Portfolio on the Efficient Frontier

Assess Risk Tolerance
- Define your acceptable level of volatility and potential drawdown.
Estimate Inputs
- Use reliable data sources (Bloomberg, Morningstar, or academic datasets) to estimate expected returns and correlations.
Use Optimization Tools
- Apply quantitative tools—Excel Solver, Python’s PyPortfolioOpt, or online optimizers—to simulate various allocations.
Validate Results
- Cross-check against benchmarks and stress-test under different market regimes.
Adjust Over Time
- Rebalance periodically as correlations, volatilities, and expected returns evolve.
The Role of Efficient Frontier in Today’s Investment Landscape
In an era of AI-driven investing, machine learning, and alternative data, the Efficient Frontier remains surprisingly relevant.
Modern optimizers use advanced statistical models—like Bayesian shrinkage and neural networks—but still rely on the same underlying principle:
- Achieve the best possible return for each unit of risk.
Leading asset managers (BlackRock, Vanguard, JPMorgan AM) continue to use efficient frontier analytics to:
- Build model portfolios for ETFs and multi-asset funds.
- Define strategic vs. tactical asset allocation ranges.
- Evaluate fund performance against risk-adjusted benchmarks.
According to Morningstar (2024), over 70% of global balanced funds reference Efficient Frontier methodology when setting allocation guidelines.
Common Misconceptions About the Efficient Frontier
- “Efficient portfolios always outperform the market.”
Not necessarily. They are efficient given model inputs, but real markets are unpredictable. - “The frontier is static.”
In reality, it shifts constantly as correlations and volatilities change. - “Diversification guarantees profit.”
It reduces volatility, not market risk. - “The model doesn’t work in crises.”
It must be complemented by behavioral and macro risk models to remain useful under stress.
Conclusion
Efficient Frontier remains a timeless principle in modern finance—bridging theory, mathematics, and real-world investing. It provides a quantitative compass that guides investors toward rational risk-taking, efficient diversification, and disciplined portfolio management.
See more: