
Continuation patterns are one of the most powerful concepts in technical analysis. They signal that an existing trend is taking a pause—before continuing in the same direction. Understanding these formations helps traders identify optimal entry points, manage risk, and ride the momentum more confidently. Visit tipstrade.org and check out the article below for further information
What Are Continuation Patterns and How Do They Work?
- Continuation patterns represent brief consolidation phases within a dominant trend.
- Rather than signaling reversal, they suggest that the market is temporarily “catching its breath” before resuming the prior direction.
- In bullish trends, continuation patterns often appear after sharp price rallies.
- The market moves sideways or slightly down as buyers take profit.
- Once selling pressure subsides, demand returns, driving prices higher again.
- Conversely, during bearish markets, these patterns appear after strong declines—prices pause before the downtrend continues.
- This structure helps traders confirm that momentum remains intact.
- Common signs include reduced trading volume during consolidation and a breakout accompanied by volume expansion.
- According to Investopedia (2024), volume confirmation remains a key element in validating continuation setups.
- Investor Psychology: Understanding How Emotion & Bias Shape Smart Investing
- Fundamental Analysis Stock Investing – The Complete Guide for Smart Investors
- How to Start Stock Investing: A Beginner’s Guide to Building Wealth
-
Global Stock Investing – A Complete Guide for Modern Investors (2025 Edition)
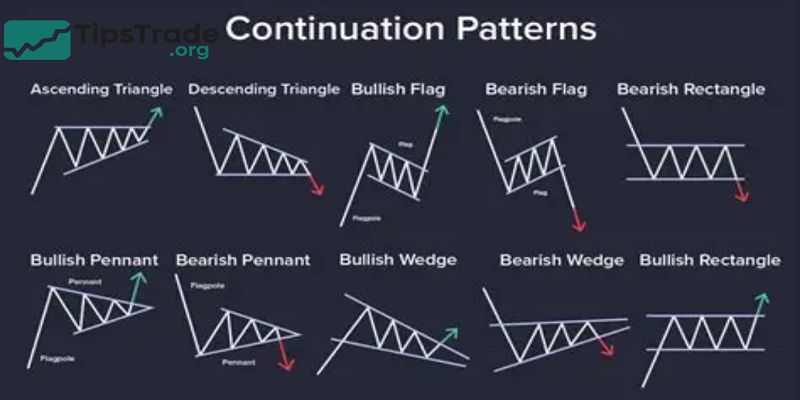
Types of Continuation Patterns
Each continuation pattern carries its own characteristics and psychology. Below are the most recognized types in classical chart analysis.
Triangles (Ascending, Descending, and Symmetrical)
Triangles occur when price action compresses between converging trendlines.
- Ascending triangles show higher lows and a flat resistance line—indicating buyers’ strength.
- Descending triangles reflect lower highs with horizontal support—signaling seller dominance.
- Symmetrical triangles form as both sides contract, showing temporary indecision before breakout.
Traders often anticipate a continuation in the direction of the existing trend. Bulkowski’s Encyclopedia of Chart Patterns (2023) reports that symmetrical triangles resolve in the trend’s direction roughly 60% of the time when confirmed by volume.
Flags and Pennants
Flags and pennants appear after a sharp directional move called the flagpole.
- Flags are rectangular consolidation zones sloping slightly against the trend.
- Pennants resemble small symmetrical triangles that form after a rapid move.
Both patterns represent short pauses in strong markets. A breakout from these structures often leads to another move approximately equal to the length of the previous flagpole.
For example, if gold rallies $50 before forming a flag, traders may project a similar $50 move after the breakout.
These patterns are favorites among short-term traders because they provide clear entry and stop-loss levels.
Rectangles
- A rectangle forms when price moves between parallel support and resistance levels for a period.
- It reflects a balance between buyers and sellers. Once the breakout occurs, the direction of the move often matches the preceding trend.
- Rectangles are easy to recognize and work well in trending markets, especially when supported by volume analysis.
- Example: A stock rising from $80 to $100 enters a range between $98 and $102.
- If it breaks above $102 with strong volume, the continuation signal activates—targeting $120 based on the rectangle’s height projection.
Cup and Handle as a Continuation Formation
- Though often viewed as a reversal pattern, the cup and handle can act as a continuation setup within long-term uptrends.
- After a rounding base (“cup”), prices dip slightly (“handle”) before resuming upward. When volume expands on the breakout above the cup rim, continuation potential strengthens.
- Research from O’Neil’s “How to Make Money in Stocks” (2020) shows that cup-and-handle formations in growth stocks often lead to significant gains if breakout volume is 40% above average.
How to Identify and Analyze Continuation Patterns
Identifying continuation patterns requires both technical precision and contextual awareness.
Confirming an Existing Trend
- A continuation pattern only makes sense within a clear, established trend.
- Traders should confirm trend direction using tools like moving averages, ADX, or trendlines.
- Patterns that form in sideways markets often fail or give false signals.
Drawing Support, Resistance, and Trendlines
- Plotting the boundaries of consolidation is key. Connect highs and lows to form the pattern shape—triangle, flag, or rectangle.
- Accurate trendline drawing helps define breakout levels and invalidation points.
Volume as a Confirmation Tool
- Volume typically decreases during consolidation and spikes during breakout.
- A volume surge confirms that institutional traders support the continuation move.
- According to CFI (2024), volume confirmation increases breakout reliability by 25–30%.
Entry, Stop Loss, and Take-Profit Levels
- Entry: Place pending orders slightly above resistance (bullish) or below support (bearish).
- Stop-Loss: Set below the opposite side of the pattern.
- Target: Measure the pattern’s height or the flagpole length to project a target.
Recognizing False Breakouts
- False breakouts occur when price moves beyond a boundary but quickly reverses.
- Signs include low volume, long wicks, or breakouts against the prevailing trend.
- Seasoned traders often wait for a retest of the breakout zone to confirm validity.
Real-World Examples and Case Studies
Flag Pattern in an Uptrend (Gold Futures Example)
- In mid-2024, gold prices surged from $2,150 to $2,300, then entered a tight downward flag.
- Volume decreased, and price consolidated near $2,270.
- When gold broke above the flag on rising volume, it quickly advanced toward $2,400, confirming a textbook continuation.
Symmetrical Triangle in a Downtrend (NASDAQ 100)
- During 2023’s correction, the NASDAQ 100 formed a symmetrical triangle within a broader downtrend.
- The breakout to the downside led to a 5% follow-through decline.
- Analysts noted that volume expanded 35% on the breakdown—validating the bearish continuation.
Rectangle Breakout (Crude Oil Futures)
- Oil prices traded between $70 and $75 for weeks, forming a rectangle. A breakout above $75 with heavy volume sent prices to $80 within days.
- Traders who waited for a daily close confirmation avoided the prior false signals within the range.
Advantages, Limitations, and Risks
Advantages
- Provide structured entry/exit points.
- Work across timeframes (1-minute to weekly).
- Easy to visualize with clear geometric boundaries.
- Reinforce trend-following strategies
Limitations
- Require existing trend confirmation.
- False breakouts are common in low-volume markets.
- May overlap with reversal patterns, causing confusion.
Key Risks
- Over-anticipation before breakout confirmation.
- Ignoring market context (fundamental catalysts).
- Poor risk management—trading oversized positions.
Tip: Always use stop-loss orders and risk only 1–2% per trade to preserve capital.
Trading Strategies Using Continuation Patterns
Choosing the Right Timeframe
- Day traders focus on flags and pennants in 5- or 15-minute charts, while swing traders prefer triangles on daily charts.
- Longer patterns often yield larger moves but require patience.
Combining Indicators for Confirmation
Using RSI, MACD, or moving averages helps filter false signals. For instance:
- RSI should not show divergence against the breakout direction.
- MACD crossing above zero during bullish continuation adds conviction.
- Volume + price breakout combination is the strongest confirmation.
Risk and Money Management
Apply the 2% rule—never risk more than 2% of account equity on one trade. Use position sizing formulas to align stop distance and risk per trade.
| Pattern Type | Entry Trigger | Stop-Loss Placement | Typical Target |
| Flag | Breakout above flag | Below lower flag line | Flagpole length |
| Triangle | Close beyond trendline | Opposite side of triangle | Pattern height |
| Rectangle | Breakout close | Opposite side of range | Range height |
Keeping a Trading Journal
- Document pattern type, market context, volume data, and outcome.
- Reviewing past trades builds pattern recognition skill—a hallmark of professional traders.
Conclusion
Continuation patterns remain essential tools for traders aiming to trade with the trend, not against it. By recognizing formations such as triangles, flags, pennants, and rectangles, traders can spot pauses in momentum and plan precise entries. When combined with volume confirmation, sound risk management, and patience, these setups provide an edge in every market—stocks, forex, commodities, or crypto.
See more: