

In the ever-volatile world of financial investing, identifying market trends is a key factor for success. In this context, continuation candlestick patterns serve as signals indicating that the current trend is likely to persist, helping traders make more confident trading decisions. In this article, tipstrade.org highlights the key continuation candlestick patterns that every trader should know. The main objective is to examine the structure of these patterns, how they work, the messages they convey, and to share simple yet effective trading strategies based on continuation patterns.
What is a continuation candlestick pattern?
In technical analysis, continuation candlestick patterns act as signals indicating that the current market trend is likely to be maintained. Imagine a person climbing a mountain who occasionally stops to rest before continuing the ascent. Continuation candlestick patterns work in a similar way: they suggest that after a brief correction or consolidation, price will continue moving in its original direction—rising in an uptrend and falling in a downtrend.
Thanks to these patterns, traders can use them to confirm trends, identify potential trade entry points, and manage risk more effectively. For example, triangles, flags, and wedges are among the most common types of continuation patterns, each providing different predictive insights. However, it is important to note that these patterns are not always perfectly accurate, so traders should combine them with other technical analysis tools to gain a more comprehensive view and make well-informed trading decisions.
See more:
- Best bearish reversal candlestick patterns not to be missed
- Top 8 powerful bullish reversal candlestick patterns you need to know
- Marubozu Candlestick: A Detailed Guide to Identification and Effective Trading
- What is the Tweezer candlestick pattern? Characteristics and how to identify it
Top continuation candlestick patterns you should know
Here is a detailed explanation of four powerful continuation candlestick patterns in in trading:
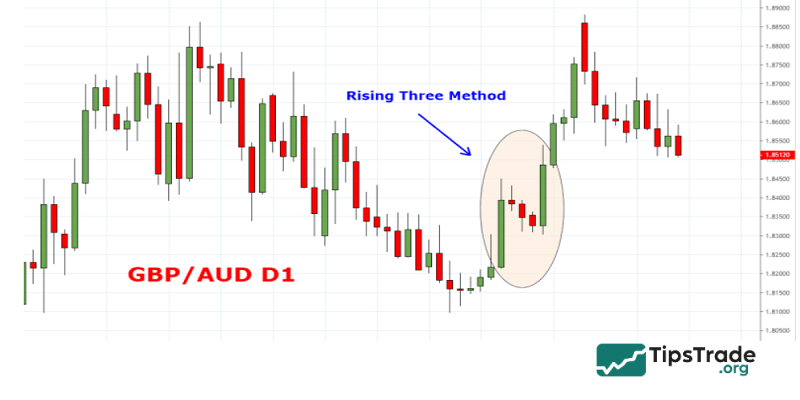
Rising Three Method Candlestick
In an uptrend, the Rising Three Method candlestick pattern appears as a signal indicating that the market is likely to continue rising more strongly. This pattern is identified by five distinctive candlesticks:
- The first candlestick: a strong bullish candle, reflecting the dominant strength of buyers.
- The next three candlesticks: small-bodied bearish candles, showing that buyers are taking profits or that some short-term traders are “buying at the top,” causing a slight pullback in price.
- The fifth candlestick: a strong bullish candle with a large body, closing at a price higher than the first candle, confirming that buyers have regained control and pushed the price to a new level.
The Rising Three Method pattern reinforces the strength of the ongoing uptrend. It indicates that although there is a brief short-term correction, buyers remain in control of the market and are ready to drive prices higher.
More specifically, the meaning of each candlestick in the pattern is as follows:
- The first strong bullish candle: Represents the initial dominance of buyers, who aggressively push prices upward.
- The next three small bearish candles: Indicate profit-taking or selling by traders who entered at higher prices, creating mild downward pressure. However, the small bodies of these candles suggest that sellers lack sufficient strength to reverse the trend.
- The final strong bullish candle: Confirms that buyers have returned and regained control. The fact that the closing price is higher than that of the first candle shows that the uptrend is continuing with strong momentum.
In summary, the Rising Three Method is a positive signal for investors holding long positions. It suggests that the uptrend remains intact and is likely to continue in the near future.
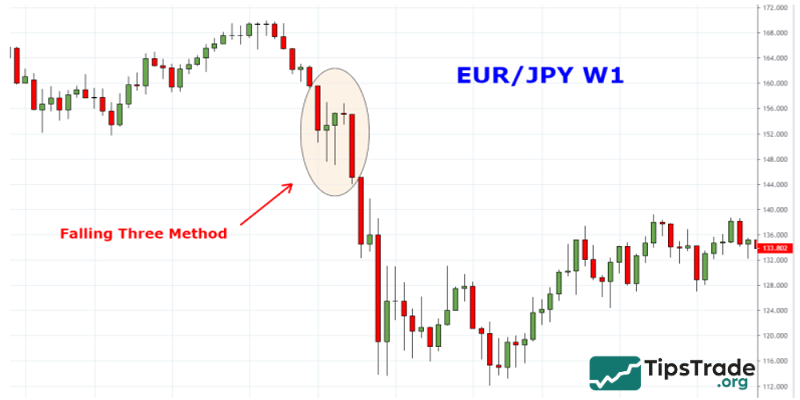
Falling Three Method Candlestick
The Falling Three Method candlestick pattern is a signal indicating the continuation of a downtrend, and it may even suggest a stronger decline ahead.
Identification characteristics:
- The first candlestick: a strong bearish candle, showing that selling pressure is dominating the market.
- The second, third, and fourth candlesticks: three small bullish candles, reflecting weak resistance from buyers.
- The fifth candlestick: a strong bearish candle that closes lower than the first candle, confirming the continuation of the downtrend.
The Falling Three Method is described as a bearish reversal candlestick pattern, often appearing after an uptrend. Its significance lies in signaling the weakening of buying pressure and a high probability that the market will turn downward. More specifically, the meaning of this pattern can be explained as follows:
- The first strong bearish candle: Indicates increasing selling pressure, with sellers gaining control of the market.
- The next three small bullish candles: Represent attempts by buyers to push prices higher again, but the buying strength is weak and insufficient to reverse the trend. This suggests that buyers are gradually losing momentum and confidence in the uptrend.
- The final strong bearish candle: Confirms the failure of buyers and the continuation of the downtrend. This candle typically closes below the opening price of the first bearish candle, highlighting strong selling pressure.
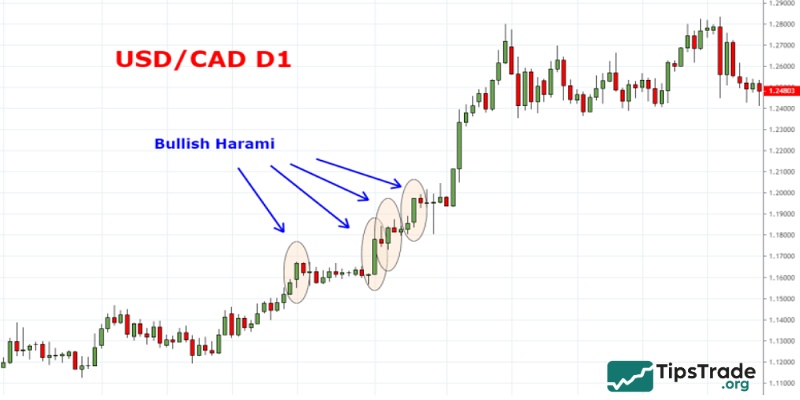
Bullish Harami Candlestick
The Bullish Harami candlestick is a bullish reversal pattern that typically appears after a downtrend. The word “Harami” in Japanese means “pregnant woman,” referring to the shape of this pattern, in which a large candle (the “mother” candle) contains a smaller candle (the “child” candle).
Identification characteristics:
- The first candlestick: a strong bearish candle with a large body, indicating that selling pressure is dominant.
- The second candlestick: a small bullish candle whose body is completely contained within the body of the previous candle. This suggests that selling pressure is weakening and buyers are beginning to gain strength.
The Bullish Harami is a reversal candlestick pattern that forms in a downtrend and signals the potential for prices to move higher. Its significance lies in the shift from selling pressure to buying pressure in the market. More specifically, the meaning of the Bullish Harami pattern can be explained as follows:
- The first strong bearish candle: Shows that sellers are still in control, continuing to push prices lower. However, it also implies that selling momentum may be gradually exhausting.
- The second small bullish candle: Appears within the range of the previous bearish candle’s body, indicating that selling pressure has weakened significantly. Buyers begin to enter the market, creating demand that pushes prices higher, although the strength is still limited. This candle reflects hesitation from sellers and uncertainty among buyers.
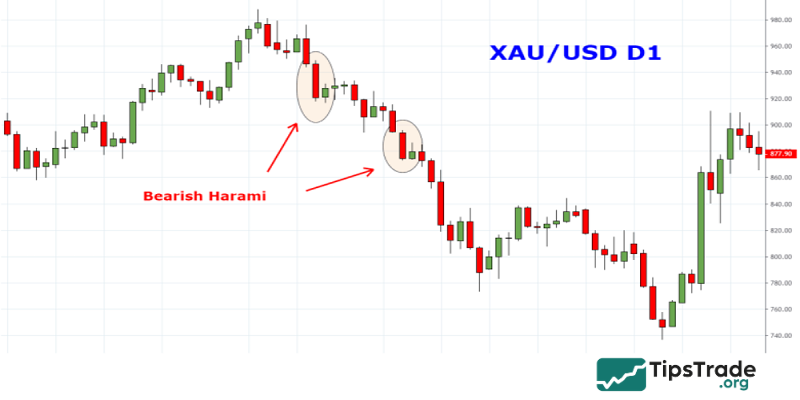
Bearish Harami Candlestick
The Bearish Harami candlestick is a bearish reversal pattern that typically appears after an uptrend. It signals weakening buying pressure and the possibility that prices may decline. Similar to the Bullish Harami, the term “Harami” originates from the Japanese image of a “pregnant woman,” describing a large candle that contains a smaller one.
Identification characteristics:
- The first candlestick: a strong bullish candle with a large body, indicating dominant buying pressure.
- The second candlestick: a small bearish candle whose body is completely contained within the body of the previous candle. This suggests that buying momentum is weakening and sellers are beginning to gain control.
When the Bearish Harami appears in an uptrend, it serves as a warning sign of a potential bearish reversal. It reflects a shift from buying pressure to selling pressure in the market. More specifically, the meaning of the Bearish Harami pattern can be explained as follows:
- The first strong bullish candle: Shows that buyers are in control, continuing to push prices higher. However, this also implies that buying momentum may be gradually running out.
- The second small bearish candle: Forms within the range of the previous bullish candle’s body, indicating that buying pressure has weakened significantly. Sellers begin to enter the market, creating supply that pulls prices lower, although the strength is still limited. This candle signals hesitation among buyers and uncertainty from sellers.
Notes on using continuation candlestick patterns
The success rate of continuation candlestick patterns is generally higher than that of reversal patterns. However, to use these patterns as safely as possible, you should combine them with confirmation from additional tools or indicators such as RSI and MACD.
In addition, there are three key principles that should be followed when using continuation candlestick patterns:
- Rule 1: Continuation candlestick patterns are not a perfect strategy
Everyone would be able to become wealthy if they could trade successfully and consistently using only candlestick patterns without the need for complex plans or strategies. This is clearly unrealistic. You should not rely too heavily on continuation candlestick patterns; instead, you should continuously improve and expand your trading knowledge.
- Rule 2: Continuation candlestick patterns must appear within a confirmed trend
In a sideways or ranging market, if you notice any of the continuation candlestick patterns mentioned above, it is best to stay out of the trade. When the market lacks a clear trend, “trend continuation” is generally not possible.
- Rule 3: Combine continuation candlestick patterns with other tools and indicators
This rule is closely related to Rule 1. Your candlestick patterns will not be reliable unless you “strengthen” them by combining them with other indicators, thereby creating trades with the highest possible probability of profitability.
Conclusion
In summary, continuation candlestick patterns are useful tools that help traders, especially beginners, identify the current market trend and make appropriate trading decisions. Mastering knowledge of common continuation candlestick patterns enables investors to improve their market-reading skills, identify entry points, set stop-loss levels, and take profits more effectively. However, to increase forecasting accuracy, these patterns should be combined with other technical indicators, volume analysis, and an assessment of the overall market context.
See more:
- How to Use the Hammer Candlestick for the Most Effective Trading
- Shooting Star Candlestick Pattern: How to Identify and Trade It Effectively
- What is a Doji candlestick pattern? Common Doji candlestick patterns in investing
- What is price action? A complete guide to price action trading from basics to advanced