
MACD vs RSI are two very popular momentum indicators. Thanks to their ability to provide reliable trading signals, MACD vs RSI are also frequently used together in trading strategies. So, what is the relationship between these two indicators? What are the differences between MACD vs RSI? And which indicator is better for your trading strategy? Let’s explore the details with Tipstrade.org!
MACD vs RSI explained
What is the MACD indicator?
The MACD indicator, also known as the (Moving Average Convergence/Divergence), is a trend-following momentum indicator that shows the relationship between two moving averages of an asset’s price. It consists of three components:
- MACD Line: The difference between the 12-period EMA (Exponential Moving Average) and 26-period EMA;
- Signal Line: A 9-period EMA of the MACD line;
- Histogram: A bar graph showing the distance between the MACD Line and Signal Line.

The MACD indicator helps traders identify changes in the strength, direction, and momentum of a trend. When the MACD Line crosses above the Signal Line, it’s a bullish signal (potential buy). When it crosses below, it’s a bearish signal (potential sell).
Why is this indicator important? Developed by Gerald Appel in the 1970s, the MACD helps identify trend reversal points as well as continuation patterns. This is why it has become a favorite tool among swing traders and long-term investors.
- How to Use the Momentum Indicator when Trading
- The Ichimoku Indicator: What It Means and How to Use It
- OBV Indicator: How to Use It for Effective Trading Strategies
- Bollinger Bands – An effective technical indicator for investment trading!
What is the RSI indicator?
The RSI indicator, also known as the Relative Strength Index, is a momentum oscillator that measures the speed and change of recent price movements. It provides a reading between 0 and 100:
- Above 70: Typically overbought, suggesting a possible price correction.
- Below 30: Oversold, indicating a potential bounce or rally.

Created by J. Welles Wilder Jr. in 1978, the RSI indicator helps traders evaluate whether a financial asset is overbought or oversold relative to its recent trading activity.
Why is this indicator important? RSI provides a quick insight into potential reversal points and serves as an effective tool for identifying short-term trading opportunities.
Compare the MACD vs RSI
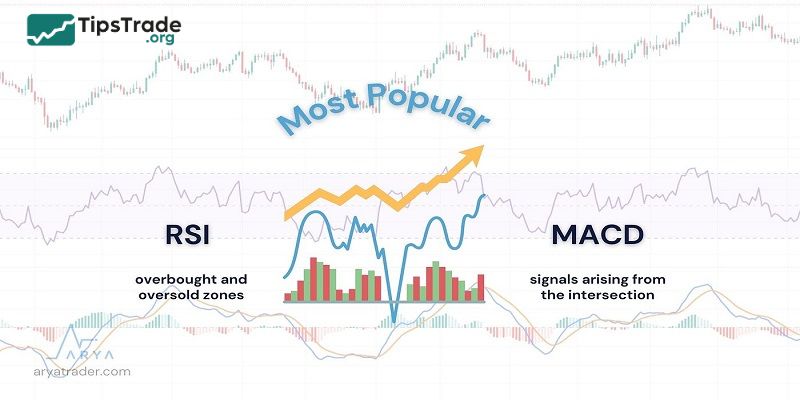
MACD vs RSI: What’s the similarity?
- Both MACD vs RSI are powerful momentum indicators. Thanks to their ability to provide reliable signals, these two indicators are widely used in technical analysis to monitor market volatility and price movements.
- MACD vs RSI are also highly sensitive to trend reversal signals. For this reason, many investors choose to use both indicators together to support their trading strategies. In such cases, they act as complementary tools that provide additional signals and help confirm market information.
- Both the MACD vs RSI indicators can also be used to confirm divergence and convergence signals. By effectively utilizing these signals, investors can gain significant advantages when executing trades.
MACD vs RSI: What’s the difference?
There are some differences between the MACD vs RSI indicators. Let’s explore the details in the comparison table below:
|
Feature |
RSI |
MACD |
|
Type of Indicator |
Momentum oscillator |
Trend-following momentum oscillator |
|
Primary Focus |
Speed and change of price movements; identifying overbought/oversold conditions. |
Relationship between two moving averages; trend direction and momentum strength. |
|
Components |
Single line, plotted between 0 and 100. |
MACD line, Signal line, and Histogram; oscillate around a zero line. |
|
Calculation Basis |
Average gains versus average losses over a period (e.g., 14 periods). |
Difference between two Exponential Moving Averages (EMAs) (e.g., 12-period EMA – 26-period EMA). |
|
Scale/Range |
Bounded: 0 to 100. |
Unbounded: Can extend indefinitely above or below the zero line. |
|
Key Signals |
Overbought (>70), Oversold (<30), Divergence (bullish/bearish). |
Crossovers (MACD line & Signal line, MACD line & Zero line), Divergence, Histogram peaks/troughs. |
|
Lag vs. Lead |
Can act as a leading indicator for reversals (especially with divergence). |
Generally, a lagging indicator, confirming trends after they’ve begun. |
|
Best Use Case |
Identifying potential reversals in range-bound or moderately trending markets. |
Confirming trends, identifying trend changes, and measuring momentum strength in trending markets. |
|
Typical Default Settings |
14 periods |
12-period EMA, 26-period EMA, 9-period EMA (for signal line). |
MACD vs RSI in different market conditions
The effectiveness of MACD and RSI depends heavily on market conditions. Here’s how they perform in various scenarios:
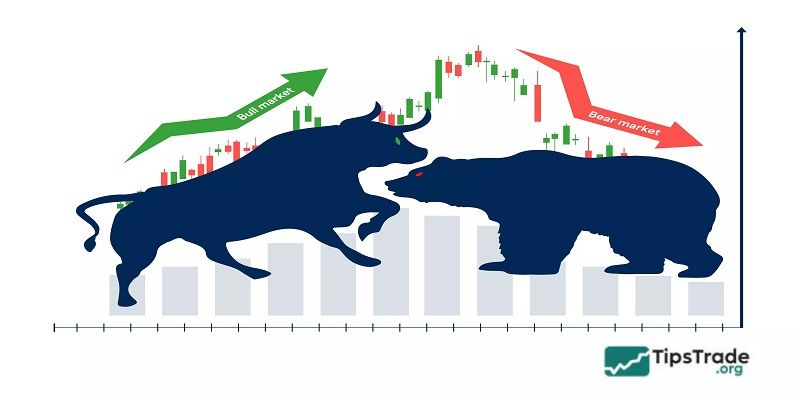
Trending markets (Bull or Bear)
- In strong market trends, the MACD indicator shows a clear advantage because it confirms both the momentum and direction of the trend. For example, during the bull run of Bitcoin in 2021, the MACD indicator consistently maintained a bullish state with multiple aligned crossovers, signaling profitable entry points.
- In contrast, the RSI indicator often generates early overbought signals (above the 70 level), which can cause traders to miss major opportunities (according to CoinDesk, “Technical Analysis in Crypto”). Therefore, MACD is generally a better choice in markets with clearly defined trends.
Sideways markets (Consolidation)
- The RSI indicator performs particularly well in range-bound markets, helping traders capture overbought and oversold swings within a limited price range. During the accumulation phase of Ethereum in 2022, RSI signaled profitable buy opportunities when it dropped below 30 and sell opportunities when it rose above 70 within a tight price range.
- Meanwhile, the MACD indicator tends to generate choppy signals in such conditions because moving averages struggle when prices lack a clear directional movement. Therefore, RSI is considered an ideal tool for sideways markets.
Volatile markets (Flash crashes or pumps)
- Both indicators can struggle when facing erratic movements in financial markets, such as flash crashes or pump-and-dump schemes. For instance, during Ethereum’s May 2022 crash, MACD lagged, and RSI gave conflicting signals.
- Combining them with volume or Bollinger Bands helps filter noise.
Takeaway: Choose MACD for trending markets, RSI for range-bound markets, and use both cautiously in volatile conditions, ideally with additional indicators.
MACD vs RSI: Which indicator is better?
MACD vs RSI: Which indicator is better? It really depends on what you’re trying to do and the kind of market you’re looking at. A few pointers:
Use MACD when:
- You’re trading a market with a clear trend (up or down).
- You need to check if a trend is real and how strong it is.
- Example: A stock is climbing steadily. The MACD indicator can help you see if the upward momentum is holding up or if it’s losing steam.
Use RSI when:
- You’re trading short-term moves or quick reversals.
- The market is moving sideways, not strongly trending.
- For example, if a stock keeps bouncing between support and resistance levels, RSI can help you spot when it could reverse.
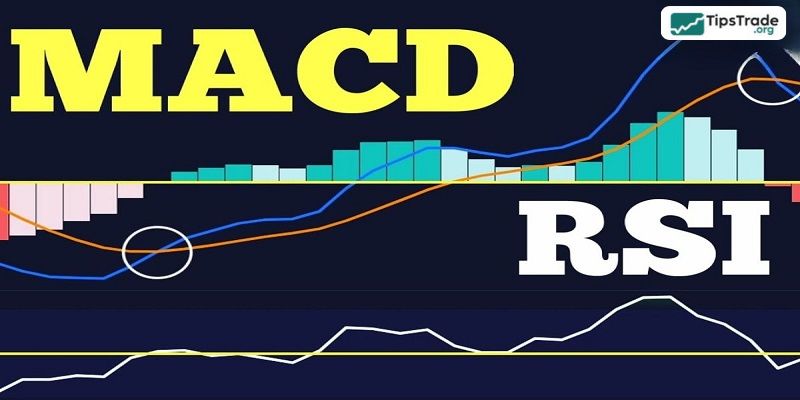
How to combine MACD vs RSI for better insights
While the MACD vs RSI can be used independently, combining them can provide even more valuable insights. Here are some ways to use MACD vs RSI together:
- Confirming signals: When both the MACD vs RSI generate similar signals, it can provide greater confidence in the trading decision. For example, if the RSI indicates an overbought condition and the MACD confirms a bearish signal, it strengthens the case for entering a short position.
- Divergence analysis: Combining the MACD vs RSI can enhance divergence analysis. If the RSI shows a divergence from the price, and the MACD also shows a divergence, it increases the likelihood of a trend reversal.
- Trend confirmation: When the RSI indicates an overbought or oversold condition, and the MACD confirms a bullish or bearish trend, it provides stronger confirmation of the trend and helps traders make more informed decisions.
By using MACD vs RSI together, traders can gain a more comprehensive understanding of market trends and improve their trading strategies.
Real-life examples of MACD vs RSI in action
To illustrate the practical application of MACD vs RSI, let’s consider some real-life examples:
- Example 1: Let’s say, stock XYZ is trading near its all-time high, and the RSI is above 70, indicating an overbought condition. At the same time, the MACD line crosses below the signal line, confirming a bearish signal. This combination of signals suggests that it may be an opportune time to sell or short the stock.
- Example 2: Now suppose, the currency pair ABC has been in a downtrend for several weeks, and the RSI is below 30, indicating an oversold condition. The MACD line crosses above the signal line, confirming a bullish signal. This combination of signals suggests that it may be a good time to buy or go long on the currency pair.
These examples demonstrate how the MACD vs RSI can be used in real-life trading scenarios to identify potential trading opportunities.
Final thoughts
As you can see, both MACD vs RSI are powerful indicators that can provide traders with significant advantages in trading. However, this does not mean that the signals from MACD vs RSI are 100% accurate, as there is always a certain level of market noise. Therefore, traders should always remain cautious when participating in the financial markets. Tipstrade.org wishes you success in your trading journey!
See more: