
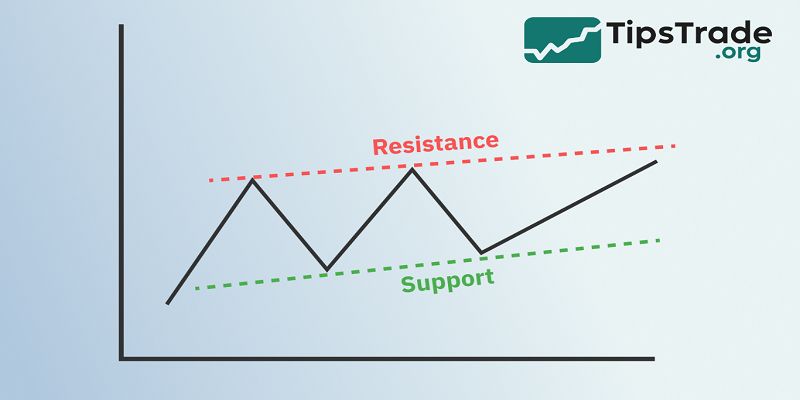
Support and resistance are among the most essential concepts in technical analysis, shaping how traders interpret market behavior and forecast potential price movement. Whether in forex, gold, stocks, or cryptocurrencies, these price zones represent psychological and structural turning points in the market. New traders often see the market as random and unpredictable, yet price frequently […]
Category Archives: Technical analysis
31
Oct
Oct
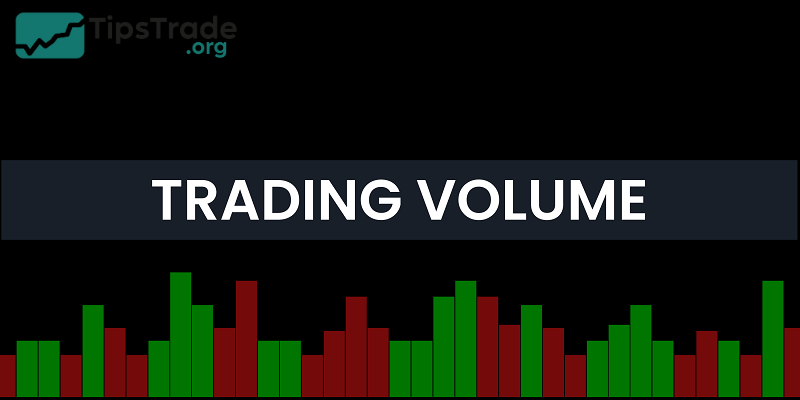
Volume trading is one of the most powerful methods traders use to understand market behavior and identify potential price movements. By analyzing trading volume, investors can gain valuable insights into the strength of trends, market sentiment, and possible reversals. In this article, Tipstrade.org will help you answer the question: What is volume trading? In addition, […]
31
Oct
Oct
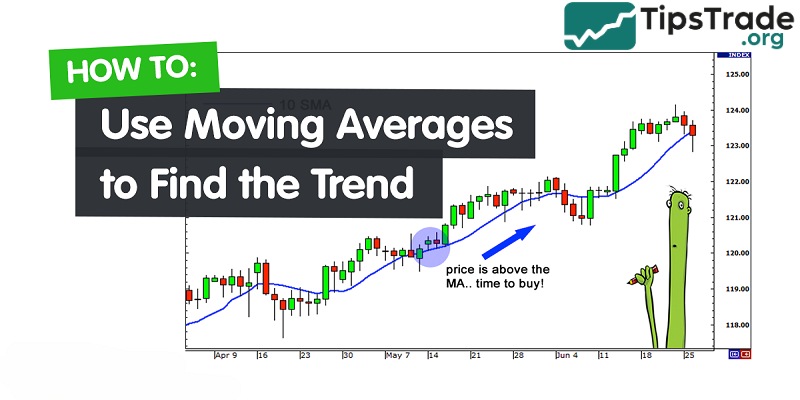
Moving averages are one of the commonly used tools in technical analysis, used to track price fluctuations in the market. So, what are moving averages? How can investors use moving averages most effectively to find the trend? Let’s explore this together in the article below. What are moving averages? Moving averages (MA) are one of […]

31
Oct
Oct
Forex volume analysis is a crucial technique that helps traders understand market dynamics by examining the relationship between trading volume and price movements. By analyzing volume patterns, traders can confirm trends, anticipate reversals, and identify key points of supply and demand in the Forex market. Volume analysis adds depth to price action and provides insights […]

31
Oct
Oct
Risk management is a structured process that helps organizations identify, analyze, and control potential events that may affect performance, assets, or reputation. In business and finance, uncertainty is a constant factor. Prices change, regulations evolve, technology disrupts industries, and human mistakes can happen at any moment. A strong risk management system does not eliminate all […]

31
Oct
Oct
Forex Chart Types are essential tools that traders use to analyze currency price movements and make informed decisions in the foreign exchange market. These charts, such as line charts, bar charts, and candlestick charts, each provide unique insights into market trends and price behavior. Visit tipstrade.org and check out the article below for further information What Are […]
30
Oct
Oct
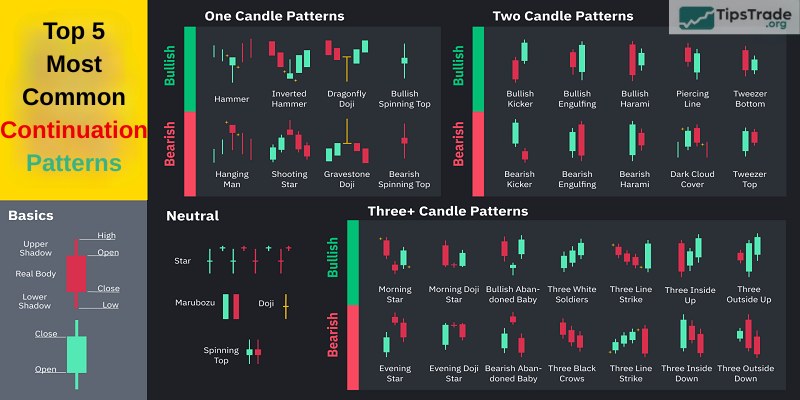
Continuation patterns often indicate that the market trend may continue in the same direction. If you are a trend trader, these patterns can provide the best trading opportunities. Below are the top 5 most common continuation patterns you should know. What are continuation patterns? Continuation patterns are candlestick patterns in technical analysis used to predict […]
30
Oct
Oct
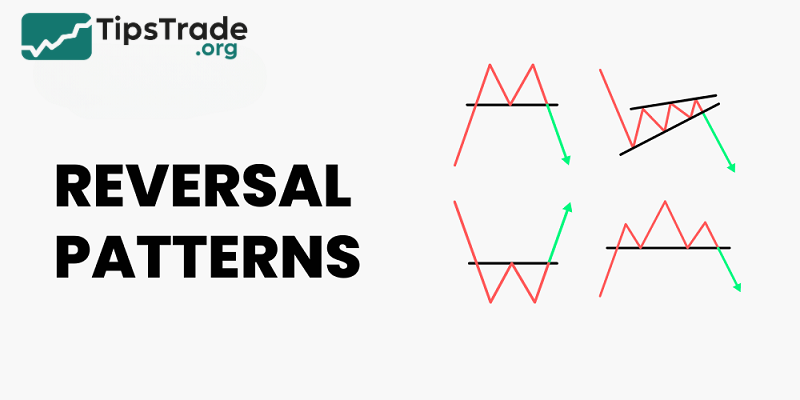
As an investor, you need to determine the appropriate entry and exit points. Let’s explore strong reversal patterns and predict future price trends through the following article! What are reversal patterns? The reversal pattern is one of the effective and popular technical analysis tools. These reversal patterns are used to signal the upward or downward […]
30
Oct
Oct
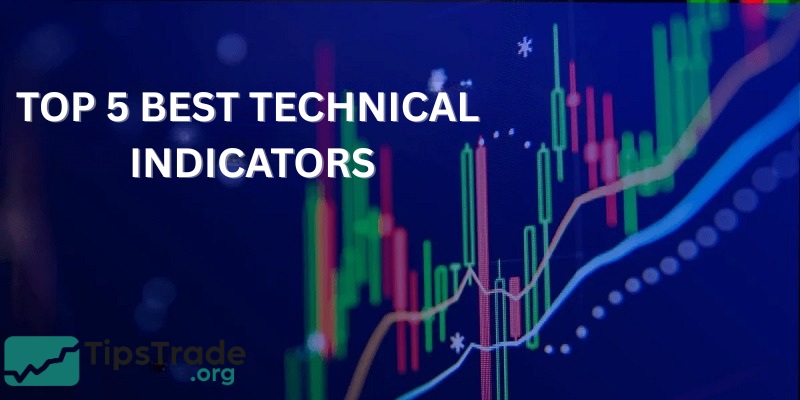
Technical indicators are indispensable tools that help technical analysts identify the appropriate times to buy and sell goods, and make informed trading decisions. Here are the technical indicators commonly used by investors in technical trading analysis. What are technical indicators? Technical indicators are tools used in technical analysis to predict the price trends of an […]
30
Oct
Oct
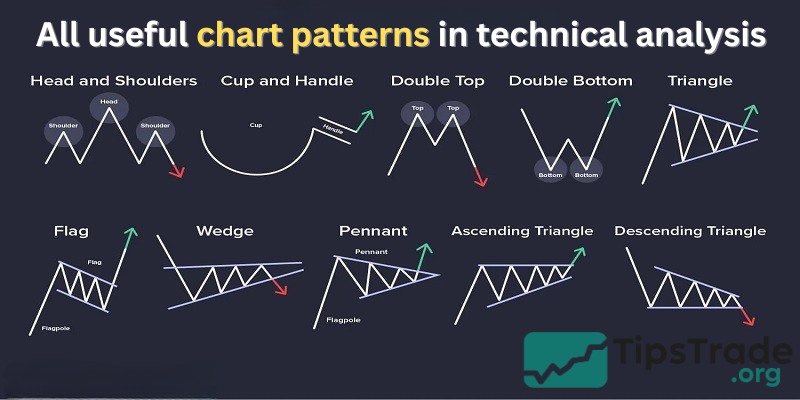
Chart patterns are a useful tool to help investors predict market trends. However, there are many different chart patterns, and distinguishing between them can be quite difficult for new investors. Let’s learn about chart patterns and common types of chart patterns with Tipstrade.org in this following article! What are chart patterns? Chart patterns are shapes […]