
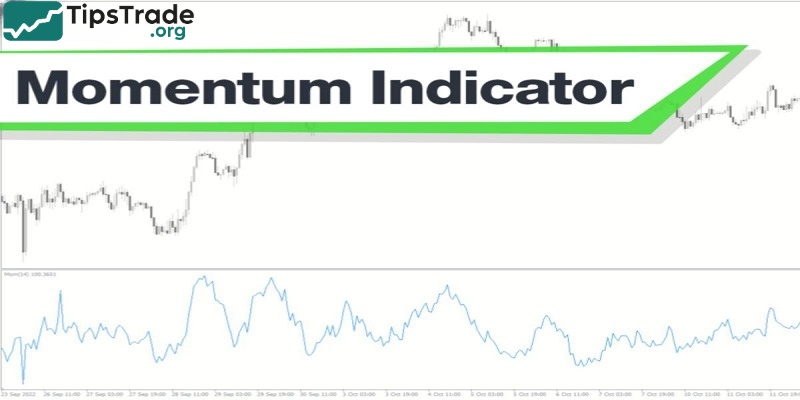
The Momentum indicator is a popular technical analysis tool used by many traders to measure market momentum. It helps them identify the strength of price trends, thereby seeking potential trading opportunities and managing risks more effectively. In this article, Tipstrade.org will provide you with useful knowledge and trading strategies to make the most of the […]
Category Archives: Technical analysis
07
Nov
Nov
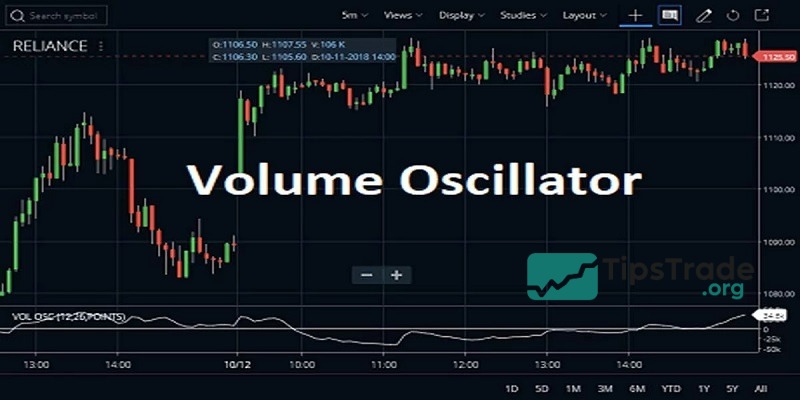
Volume Oscillator is a fairly simple technical indicator used to track market trading volume to determine future trends. In the article below, Tipstrade.org will introduce Top 5 best of volume oscillator that you shouldn’t miss in trading. Let’s get started! What is the volume oscillator? The Volume Oscillator (VO) is a technical indicator used to […]
06
Nov
Nov
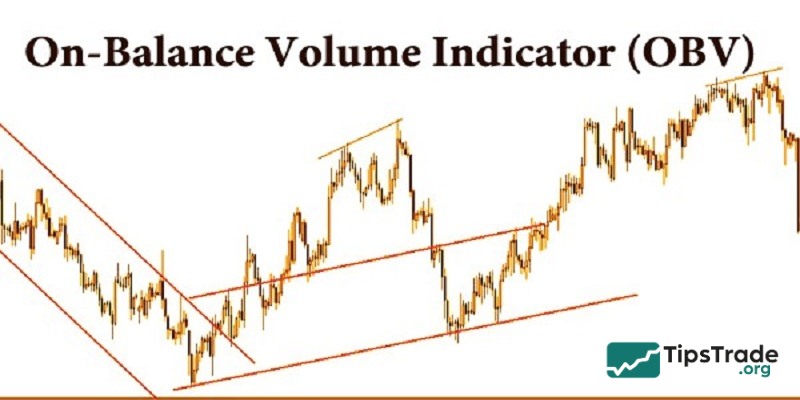
In the world of trading, predicting the direction of price movement is extremely important. And the OBV indicator itself is one of the powerful tools that supports traders in this regard. By analyzing trading volume, OBV helps us better understand the dynamics of money flow in the market. In this article, Tipstrade.org will provide you […]
06
Nov
Nov
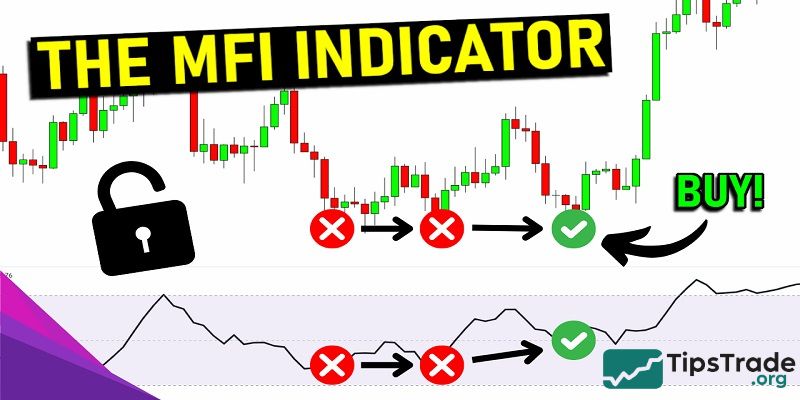
The MFI indicator assists traders in assessing the strength of cash flow in financial markets. However, is this tool truly effective in identifying trends and predicting price reversals? Are overbought or oversold signals from the MFI reliable? In this article, Tipstrade.org will provide a detailed analysis of how to calculate and use the MFI indicator […]
06
Nov
Nov
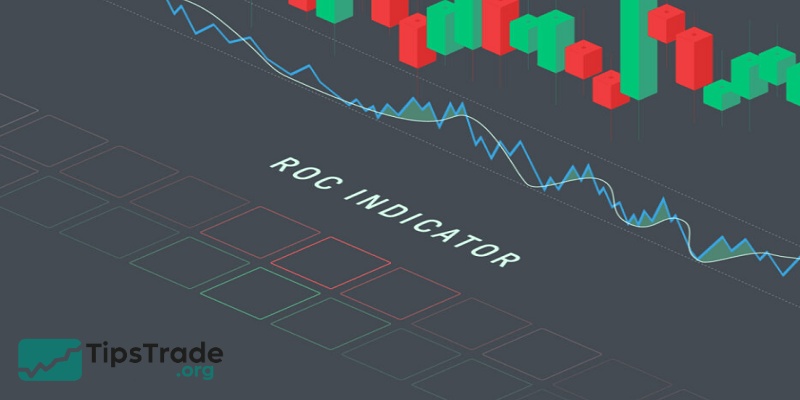
The ROC indicator is a fairly good market signal forecasting tool due to the movement of the rate of change. This rate is calculated based on the change in price candles over a defined period. So, what is the ROC indicator? How should investors use this indicator effectively in trading? The following article from Tipstrade.org […]
05
Nov
Nov
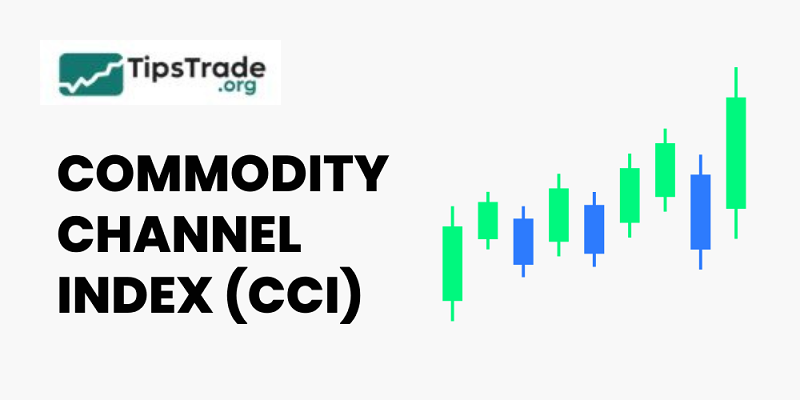
In the volatile world of financial investment, finding effective technical analysis tools is extremely important. And the CCI indicator is one of the top indicators widely used by many traders. In this article, Tipstrade.org will delve into what the CCI indicator is, how it is calculated, and most importantly, how to apply this indicator to […]

05
Nov
Nov
The RSI indicator is used to measure the magnitude of price changes over the most recent period, helping investors identify whether the market is overbought or oversold. In this article, Tipstrade.org will help you understand what the RSI indicator is, its calculation formula, and how to effectively apply the RSI to optimize your trading! What […]
05
Nov
Nov
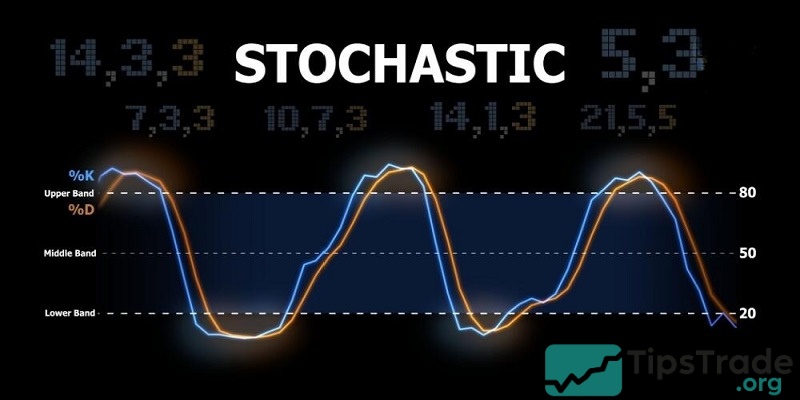
The Stochastic indicator is a popular technical analysis tool used by traders to assess price momentum and identify potential entry opportunities. However, understanding and using this indicator effectively is not always easy. This article from Tipstrade.org will provide you with insights into how the Stochastic indicator works, while also guiding you on how to optimize […]
04
Nov
Nov
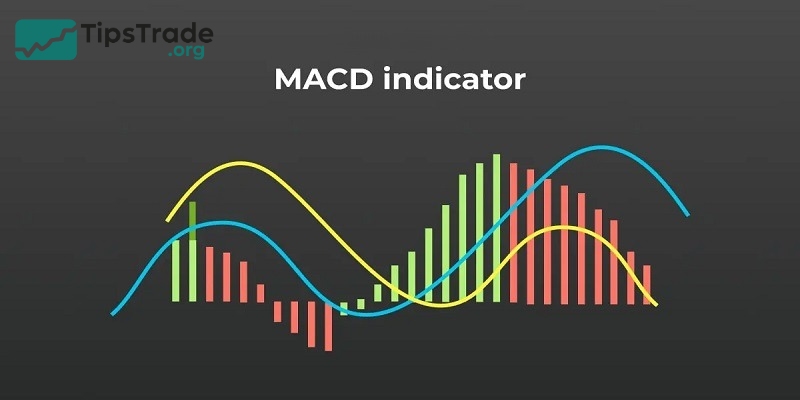
The MACD indicator is a widely used and very helpful technical indicator for investors. Understanding how to use the MACD effectively can help you find precise buy and sell points. Let’s learn about this useful indicator with Tipstrade.org in the article below! What is the MACD indicator? The MACD indicator, which stands for Moving Average […]
04
Nov
Nov
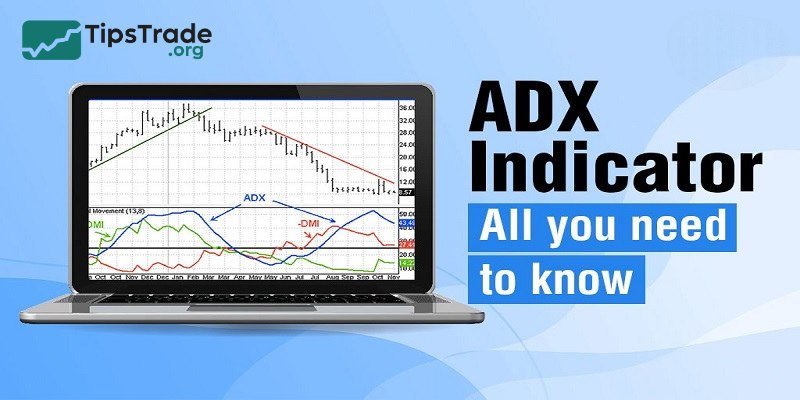
If you are a trend trader, you need to know about the ADX indicator. This is a highly regarded tool for measuring trend strength today. So, do you know what the ADX indicator is? How can you use this indicator most effectively in your trading strategy? What is the ADX indicator? ADX indicator explained The […]