

Factors affecting the stock market play a significant role in shaping investor decisions and market trends. These factors include economic indicators, political events, company performance, and global issues. Understanding these influences helps investors anticipate market movements and manage risks effectively. Analyzing these factors is essential for making informed investment choices. Visit tipstrade.org and check out […]
Category Archives: Stocks

27
Oct
Oct
Types of securities are essential financial instruments that represent ownership or creditor relationships and are key to investment and capital markets. They include various categories such as stocks, bonds, and derivatives, each serving different purposes and risk levels for investors. Understanding the different types of securities helps investors build diversified portfolios and make informed decisions […]

27
Oct
Oct
Stock market definition refers to the organized system where buyers and sellers trade shares of publicly listed companies. It plays a crucial role in the global economy by providing a platform for companies to raise capital and for investors to potentially earn returns. Understanding the stock market definition helps individuals grasp how financial markets operate […]

27
Oct
Oct
AI trading models are transforming the way financial markets operate by using advanced algorithms and machine learning techniques to analyze vast amounts of data and make automated trading decisions. These models help traders identify patterns, predict market movements, and execute trades with speed and precision that humans cannot match. Understanding AI trading models is essential […]
Efficient frontier is a key concept in investment theory that identifies the set of portfolios offering the highest expected return for a given level of risk or the lowest risk for a given return. Understanding the efficient frontier enables investors to optimize their asset allocation effectively by balancing risk and return. Visit tipstrade.org and check […]
24
Oct
Oct
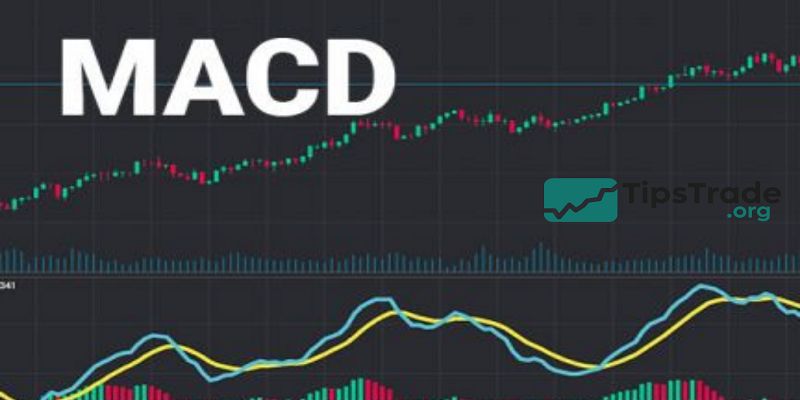
MACD Stock is a powerful technical analysis tool used by traders and investors to identify changes in the strength, direction, momentum, and duration of a stock’s price trend. This comparison helps reveal buy and sell signals based on crossovers, divergences, and momentum shifts. With its ability to indicate potential trend reversals and confirm the strength […]
24
Oct
Oct
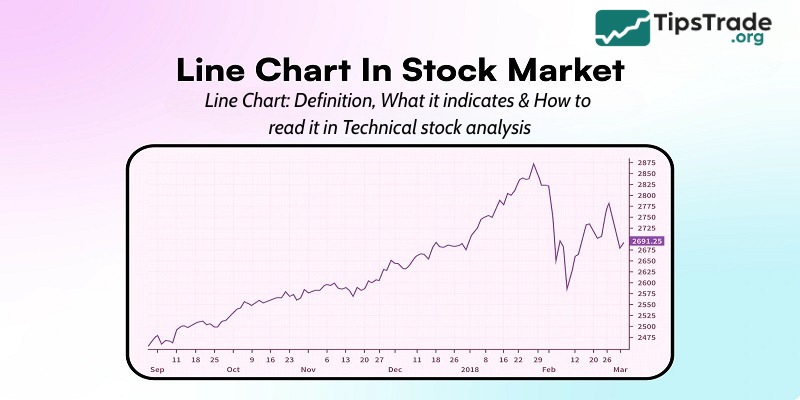
In stock investing, there are many different types of charts that help you visualize price patterns. And a line chart is one such chart. Let’s read the following article from Tipstrade.org about how to read a line chart in technical stock analysis! What is line chart in stock market? A line chart is a visual […]
24
Oct
Oct
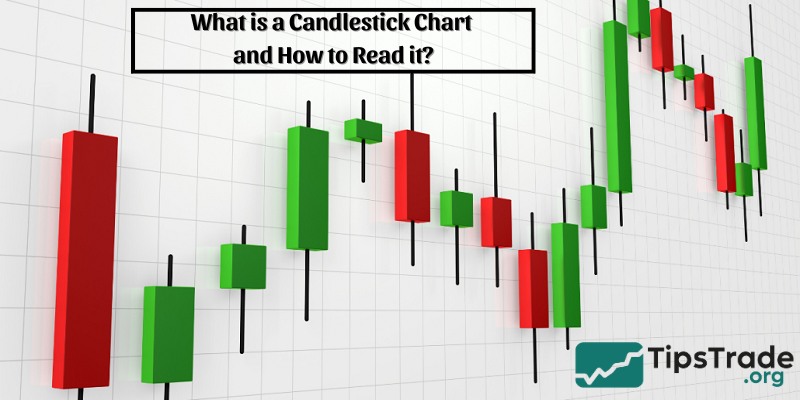
Candlestick chart is a popular term, providing a lot of useful information in stock investment. However, not everyone knows the nature of candlestick charts and how to read candlestick charts. In the article below, Tipstrade.org will help you learn about this term, helping you better understand the models and roles of candlestick charts in stock […]

24
Oct
Oct
Breakout trading is one of the most popular yet misunderstood strategies among traders across markets. Whether in stocks, forex, or cryptocurrencies, a “breakout” occurs when the price moves beyond a defined support or resistance level — signaling potential momentum in the direction of the breakout. This concept appeals to active traders because it seeks to […]

24
Oct
Oct
On-Balance Volume (OBV) indicator, developed in the early 1960s by Joseph Granville, remains one of the most respected tools for identifying momentum shifts and confirming trends. This guide explores how OBV works, why volume often leads price movements, and how traders use OBV to anticipate breakouts, validate trends, and spot early reversals. Whether you trade […]