
What is a candlestick? Candlesticks are one of the most important technical analysis tools in financial trading and are widely used across markets such as forex, stocks, cryptocurrencies, and commodities. This article provides a comprehensive overview of candlesticks – from the basic concept and structure to how to read them, common candlestick patterns, and practical […]
Category Archives: Price Action
19
Jan
Jan
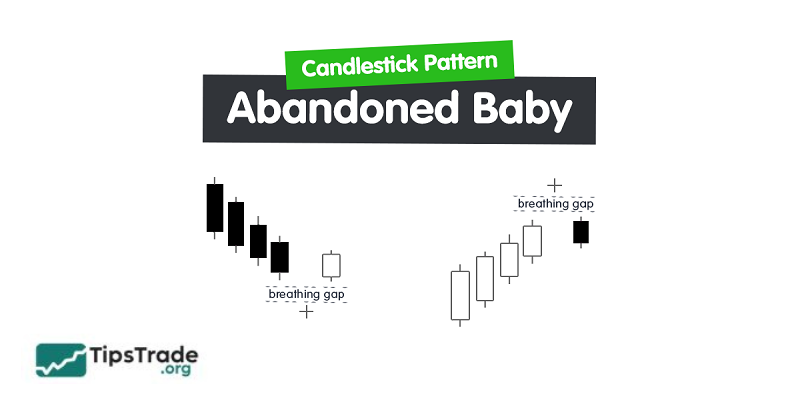
Among reversal candlestick patterns, the Abandoned baby candlestick is one of the most commonly seen and highly reliable formations. Therefore, investors who follow technical analysis need to understand it thoroughly and use it proficiently. Today, Tipstrade.org will share the key characteristics of this candlestick pattern with investors. What is an abandoned baby candlestick? Abandoned baby […]
31
Dec
Dec
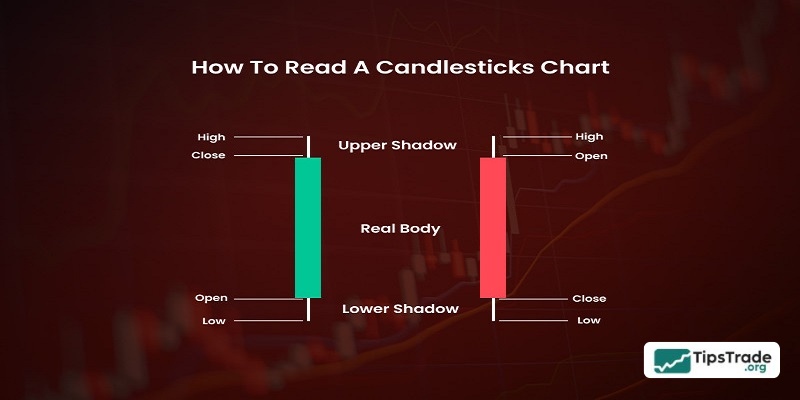
Candlestick charts are one of the most widely used tools in technical analysis. Understanding how to read candlestick chart helps investors identify trends, forecast price movements, and make more accurate investment decisions. Below is a detailed guide on how to read candlestick chart for investors to reference. Overview of candlestick charts What is a candlestick […]
31
Dec
Dec
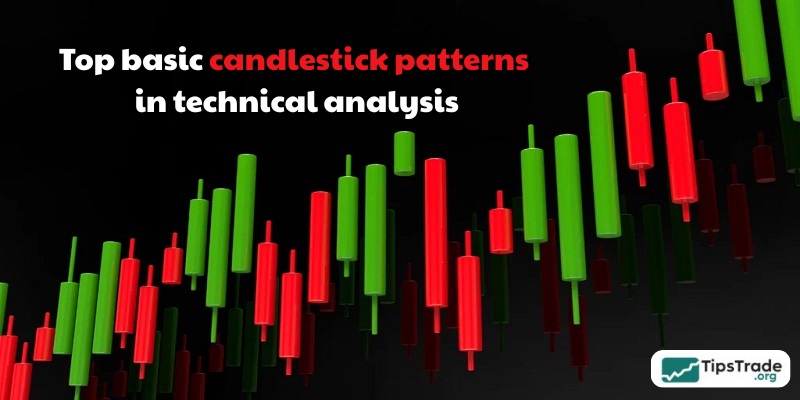
Understanding candlestick patterns correctly not only helps assess the strength of buyers and sellers, but also serves as a key to identifying trend reversals or continuation phases. Below are Top common basic candlestick patterns in technical analysis that you shouldn’t miss. What are candlestick patterns? Candlestick patterns are formations created by one or more candlesticks […]
26
Dec
Dec
In the ever-volatile world of financial investing, identifying market trends is a key factor for success. In this context, continuation candlestick patterns serve as signals indicating that the current trend is likely to persist, helping traders make more confident trading decisions. In this article, tipstrade.org highlights the key continuation candlestick patterns that every trader should […]

26
Dec
Dec
Bearish reversal candlestick patterns are a useful analytical tool that helps investors identify price movement trends in the financial markets. Let’s explore the Best bearish reversal candlestick patterns not to be missed with Tipstrade.org through the article below. What is a bearish reversal candlestick pattern? A bearish reversal candlestick pattern is a price chart formation […]
25
Dec
Dec
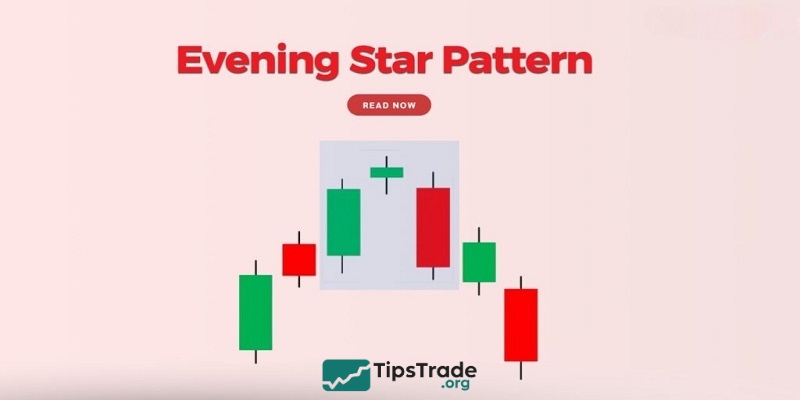
The Evening Star candlestick is one of the most commonly used multi-candlestick patterns in technical analysis due to its strong reversal signals. However, many investors still do not fully understand how to identify this pattern on price charts or how to apply it effectively in trading. Therefore, let’s join Tipstrade.org in exploring the most fundamental […]
25
Dec
Dec
As an investor, you need to determine appropriate entry and exit points. Let’s explore Top 8 powerful bullish reversal candlestick patterns and forecast future price trends in the article below. What is the bullish reversal candlestick? The bullish reversal candlestick is a specific chart formation that signals a potential shift in market sentiment from a […]
24
Dec
Dec
The Three black crows candlestick is one of the most powerful bearish reversal candlestick patterns in technical analysis. It signals the likelihood that the market is about to enter a downward phase. Join Tipstrade.org to explore the definition, how to identify it, its meaning and trading strategies related to the Three Black Crows candlestick. What […]
24
Dec
Dec
The Three white soldiers candlestick is one of the most reliable signal patterns in the market. However, not everyone truly understands its signs or how to identify it correctly. If you feel the same way, let’s join Tipstrade.org in taking a closer look at its meaning and how to trade using this candlestick pattern below. […]