
Bollinger Bands are a technical indicator that “F0” investors should learn about. This technical indicator is not complex, and its effectiveness is no less than that of other indicators. So, what are Bollinger Bands? How are the parameters in Bollinger Bands calculated? How to use the indicator will be covered in the following article!
What are bollinger bands?
In 1980, investor and financial analyst John Bollinger first introduced the concept of Bollinger Bands. Simply put, Bollinger Bands is a statistical chart that shows prices and fluctuations over time, it is considered a technical analysis indicator used to track market fluctuations.

John Bollinger was born in 1950 in Vermont, USA. His whole life was devoted to the financial industry of the US and the world. He is also one of the few analysts who have obtained the CPA and CMT certificates, which are two extremely important certificates in the American financial analysis community. Bollinger Bands were first presented by John Bollinger in the book Bollinger on Bollinger Bands published in 2001, which is now translated into hundreds of languages around the world.
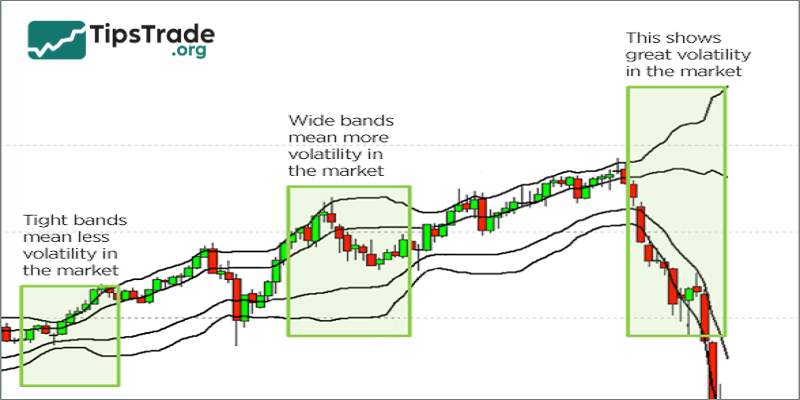
When observing Bollinger Bands, traders will be able to predict whether the market is volatile or quiet. Bollinger Bands tend to narrow, signaling that the market is quiet, and vice versa, the market will fluctuate when Bollinger Bands tend to expand.
>>See more:
- How to Use the Momentum Indicator when Trading
- Top 5 Best Types of Volume Oscillators (VO) Trader Should Know
- OBV Indicator: How to Use It for Effective Trading Strategies
- How to calculate and use the MFI indicator in technical analysis
Structure of bollinger bands
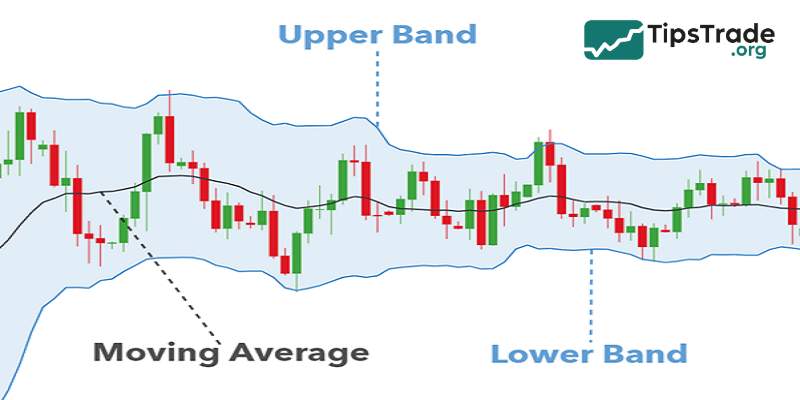
Bollinger bands consist of 3 bands:
- Middle band: The moving average (MA) of the price over a specific period. Typically, people often use the 20-day moving average.
- Upper band: Calculated by adding the middle band to the standard deviation of the price over that period, multiplied by a factor (usually 2).
- Lower band: Calculated by subtracting the standard deviation of the price over that period, multiplied by the corresponding coefficient (usually 2), from the middle band.
How to calculate bollinger bands
Formula for calculating Bollinger band parameters:
- Upper band = SMA20 + 2 x 20-day standard deviation
- Lower band = SMA20 – 2 x 20-day standard deviation
- SMA20 = Average closing price of the last 20 sessions
For example, you want to buy the USD/JPY currency pair with a rate of 109.35; SMA value is 80 and 20-day price deviation is 1.3. We calculate:
- Mid range = 80
- Upper range = 80 + 2 x 1.3 = 82.6
- Lower range = 80 – 2 x 1.3 = 77.4.
The meaning of bollinger bands in technical analysis
- Meaning of parameters in bollinger bands:
The parameters in bollinger bands play an important role in supporting investors in analyzing and making trading decisions. Each parameter has a separate meaning, contributing to the formation of an overview of price fluctuations and market trends.
Firstly, the period, usually set to 20 by default, represents the number of candles or time units used to calculate the moving average (middle band) and standard deviation. This parameter helps determine the analysis time frame and can be adjusted depending on the purpose of use.
Next, the standard deviation measures the volatility of prices, and the distance between the upper and lower bands will be wider as the standard deviation gets larger.
Finally, the multiplier, usually set at 2, is the factor used to multiply the standard deviation by, thereby calculating the distance between the upper/lower range and the middle range.
- Meaning of bollinger bands:
Bollinger Bands have several important meanings in market analysis. First, they help determine the price trend: when the price moves and closes above the middle band, the trend is likely to be up, conversely, when the price moves and closes below the middle band, the trend is likely to be down.
Next, bollinger bands measure price volatility based on the distance between the upper and lower bands. The larger the distance, the more volatile the price and vice versa. Finally, this indicator also helps identify overbought/oversold zones: when the price touches the upper band, the market may be overbought and conversely, when the price touches the lower band, the market may be oversold.
Limitations of bollinger bands
Besides the meanings it brings, bollinger bands also have several limitations that investors should be aware of:
- Information dilution due to reliance on standard deviation: Since the Bollinger Bands are calculated using the Simple Moving Average (SMA), which includes both old and new data, the information can be diluted by unusual events or significant price fluctuations in the past.
- False signals: Bollinger bands may sometimes generate false trading signals, especially in highly volatile or sideways markets. Prices can touch or even break through the upper or lower bands without leading to an actual trend reversal as predicted.
- Lagging nature: Because Bollinger bands are based on historical price data, they may lag in reflecting sudden market changes or reversals.
- Not suitable for all markets: Bollinger bands may perform better in some markets than others. Traders should test and adjust the parameters of the Bollinger Bands to suit the specific characteristics of each market.
Bollinger bands are not a standalone trading system; rather, they serve as an indicator that provides insights into potential price volatility. John Bollinger himself recommends using bollinger bands in combination with two or three uncorrelated indicators to obtain more accurate market signals. He emphasizes the importance of using different indicators, such as MACD (Moving Average Convergence Divergence) and RSI (Relative Strength Index), to improve decision-making accuracy.
The most effective bollinger bands trading strategies
Bollinger Bands are used quite a bit for technical analysis and making trading decisions. However, to ensure a higher probability of profitable trades, you need to combine some other signals:
Based on the two bands
Trading using the two outer bands of the bollinger bands is the simplest method investors can apply. The strategy is straightforward and easy to implement:
- When the price touches the lower band, investors can place a buy order.
- When the price touches the upper band, investors can place a sell order.
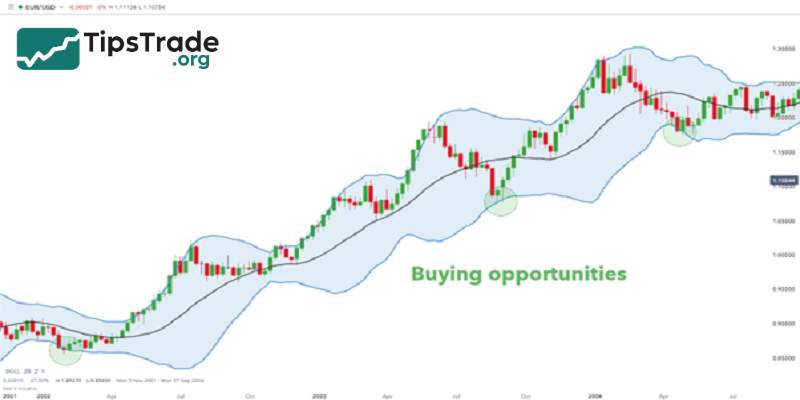
This approach is particularly effective when the market is in a sideways (ranging) condition, where the price continuously oscillates up and down within a certain range. However, when the market shows strong upward or downward trends, relying solely on the price movement and the two bands becomes risky. In such cases, it’s advisable to combine Bollinger Bands with other technical indicators, such as the RSI, to minimize false signals and make more accurate trading decisions.
Based on the “Bottleneck” pattern
The financial market is constantly moving every second during trading sessions. Periods of low volatility (sideways movement) usually occur right after high volatility phases (uptrends or downtrends). These moments act as the market’s “pause,” giving traders time to assess the situation and plan their next strategies to maximize profits.
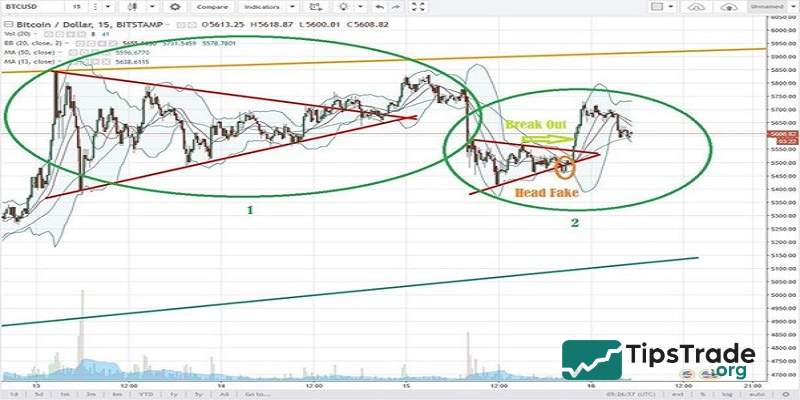
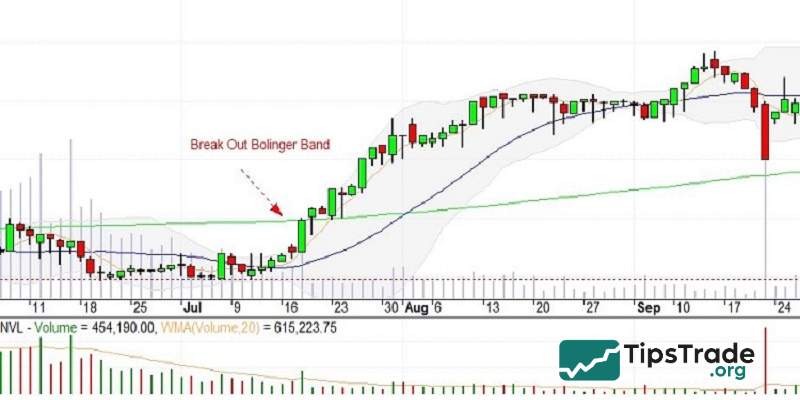
Every strong price movement is eagerly anticipated by investors. At this point, a squeeze of the bollinger bands may signal a potential significant upward or downward move in the market. When the bands contract and are followed by a breakout, it often indicates the start of a new market trend. According to this principle:
- If the squeeze is followed by a breakout above the upper band, it signals the beginning of a new uptrend.
- If the squeeze is followed by a breakout below the lower band, it suggests a new downtrend is forming.
This is another simple trading strategy widely used by traders. However, it is crucial to confirm the new market direction to avoid falling into a “Head Fake”, a situation where the price breaks out of a band but suddenly reverses or moves in the opposite direction. Therefore, traders should wait for a successful retest before entering a trade to ensure greater safety and accuracy.
Combining bollinger bands with other indicators
Even the creator of Bollinger Bands once suggested that traders should combine this indicator with RSI for better accuracy.
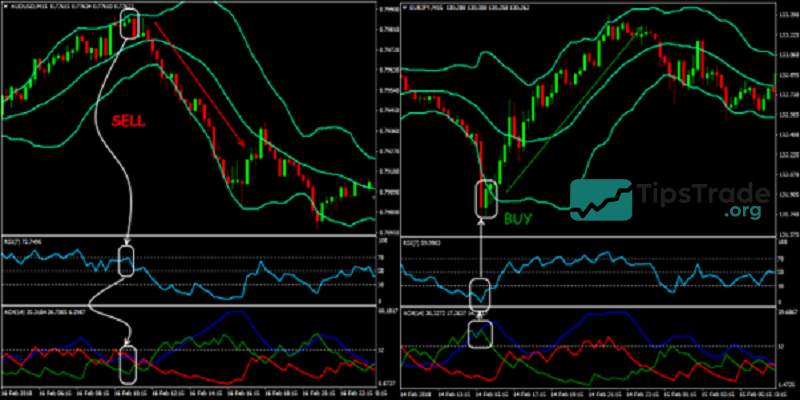
Combining with RSI
RSI belongs to the group of oscillator indicators, helping traders identify whether the market is in an oversold zone (RSI < 30) or an overbought zone (RSI > 70), which often correspond to divergence or convergence phases.
Divergence and convergence on RSI frequently occur over short periods, indicating that either buyers or sellers are losing momentum and are no longer interested in pushing prices higher or lower. However, this does not necessarily mean a trend reversal will occur. Therefore, traders should confirm signals with other indicators such as Doji candlesticks, support and resistance levels, and others to ensure higher accuracy and more successful trades.
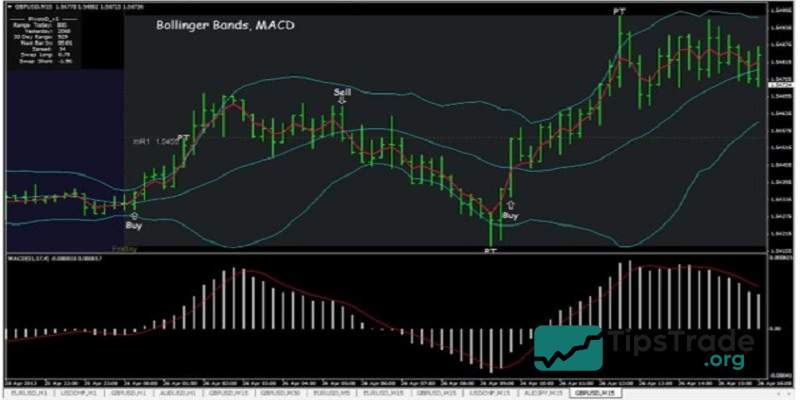
Combining with MACD
MACD is a trend-following momentum indicator, while bollinger bands help define the nature of price volatility cycles. When used together, these two tools can enhance trading precision by combining trend strength analysis with volatility assessment. This duo is especially useful for identifying current market conditions and predicting potential breakouts.
Traders can follow these steps:
- Use MACD to determine the overall price trend.
- Look for divergence in the MACD histogram to assess the likelihood of a breakout under similar past conditions.
- Identify potential entry points when the price breaks out between the Bollinger middle band and the SMA200 or trendline.
- Confirm the breakout when Bollinger Bands expand and MACD rises sharply.
Combining with support and resistance levels
A bollinger band breakout can indicate the start of a new market trend, depending on whether the upper or lower band is broken. However, as mentioned earlier, traders may encounter false breakouts (Head Fakes).
Therefore, it’s recommended to wait for a retest and use additional confirmation from support/resistance lines or other indicators such as Doji candles:
- If the price breaks out above resistance, place a Buy order.
- If the price breaks out below support, place a Sell order.
In general, trading with bollinger bands is quite straightforward if you understand the fundamental rules and combine them with other commonly used indicators.
Advanced bollinger bands trading
Below are some advanced Bollinger Bands strategies commonly used by experienced traders.
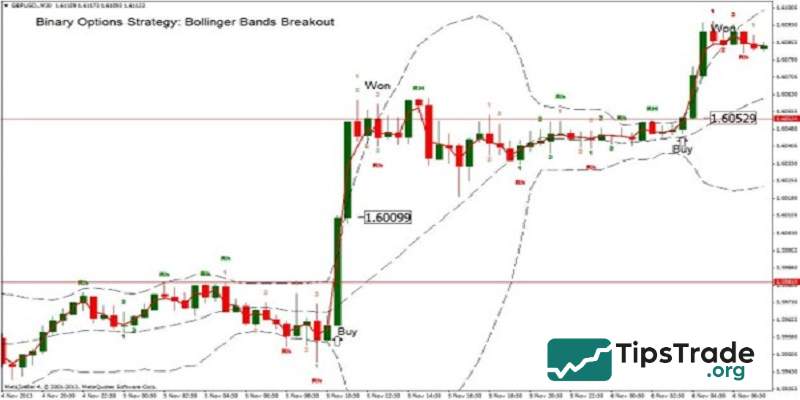
Bollinger bands breakout
The Bollinger bands breakout is a relatively simple long-term trend-following strategy. A breakout occurs when the closing price of a candlestick moves outside the bollinger bands. However, to avoid false signals, traders should combine this method with support/resistance levels and other confirming indicators.
- When the price breaks above resistance, it generates a Buy signal.
- When the price breaks below support, it generates a Sell signal.
Volatility-based trading
With this strategy, traders generally trade in two main ways:
- Buy when price volatility is low, expecting a price increase: After a period of low volatility (where the closing prices of consecutive candles are nearly equal), a strong movement often follows. Therefore, buying when the Bollinger Bands narrow and prices consolidate is a volatility-based entry strategy.
- Sell when price volatility is high (price is very high), expecting a price decrease: When the distance between the upper and lower bands widens excessively, it indicates that the market is overextended. At this point, a price correction is likely, making it an ideal time for traders to sell in anticipation of reduced volatility and a pullback.
Conclusion
Hopefully, through the above article, you have learned what Bollinger Bands are and how they are applied in trading. To use the Bollinger Bands indicator effectively, you need to practice a lot, keep records, and learn from your experiences after each trading session. According to Tipstrade.org, no trading method is completely right or completely wrong; it all depends on your experience and ability to apply it. Don’t put too much faith in any one method and force yourself into a losing position, hoping for luck. Wishing you all success soon!