
What are the best indicators TradingView? TradingView is an excellent tool for traders, as it offers a wide range of technical indicators for market analysis. However, not every indicator will suit your trading style. So, which indicators should you choose to achieve the best results? Don’t worry, Tipstrade.org has compiled the top 5 best indicators TradingView used by traders. Check out the article below to learn more!
What are TradingView indicators?
The indicators on TradingView aggregate a large amount of historical data such as opening prices, closing prices, lowest and highest price levels and trading volume. This helps investors analyze financial instruments and make accurate trading decisions. Many traders use these technical indicators for trading planning, identifying entry and exit points, and predicting future price trends.
See more:
- Discover the top 6 indicators in MT4 that are widely used
- A detailed guide on how to download and use MT4
- What is MT5 EA? Guide on how to install and use MT5 EA in detail
- MT4 vs MT5: A Detailed Comparison – Which Platform Should Traders Choose?
Why are technical indicators on TradingView highly regarded by traders?
Technical indicators on TradingView are consistently highly rated by professional traders for the following superior strengths:
- TradingView provides numerous classic and powerful indicators such as Bollinger Bands, Moving Average, RSI, MACD, and even the Ichimoku Cloud, along with many indicators created by renowned traders. Notably, all popular indicators are completely free.
- When using indicators on TradingView, users can easily set price alerts or receive trading signals via email, SMS, or pop-up notifications.
- Traders can effortlessly add and customize indicators on TradingView to match their personal preferences or trading styles.
- The drawing toolkit and 12 different chart types enable traders to apply and use indicators effectively according to their needs.
Top 5 best indicators TradingView
TradingView is a popular platform widely used by the trading community for technical analysis and trading decisions. Below, we will compile 5 best indicators TradingView.
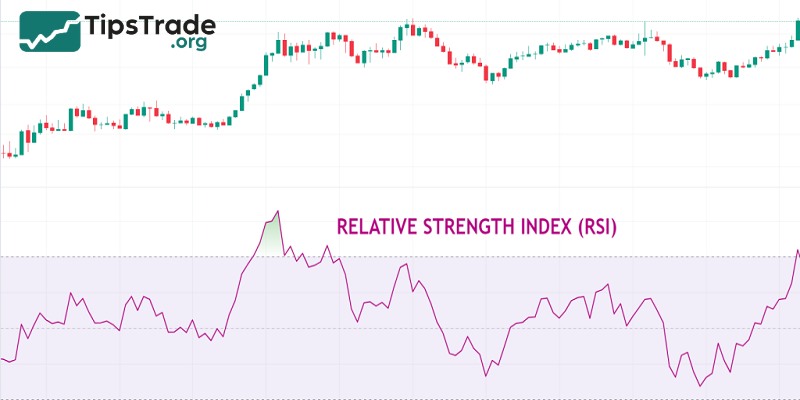
Relative Strength Index (RSI)
Relative Strength Index (RSI) is one of the best indicators TradingView and is widely favored by traders. Developed by J. Welles Wilder in 1978, the RSI is among the momentum indicators. The main function of the RSI is to identify price corrections, helping traders recognize overbought and oversold areas in the market. With its ability to provide strong trading signals, the RSI is an important tool for identifying price trends and entry points.
When the RSI crosses above 70, the market can be considered overbought, and when it falls below 30, the market can be considered oversold. This helps traders identify price volatility and potentially predict market reversal points.
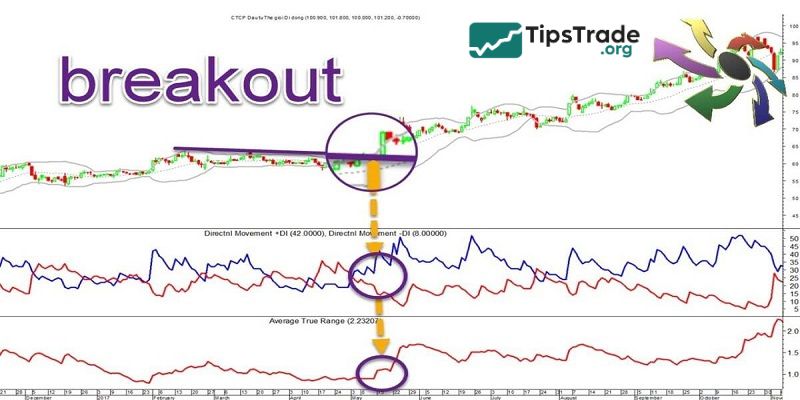
Average True Range (ATR)
The Average True Range (ATR) indicator is used to measure the actual volatility of an asset, helping traders determine the level of volatility over a given period.
Additionally, ATR provides information for setting stop losses and taking profits effectively, and helps traders make decisions about entering or exiting the market based on volatility.
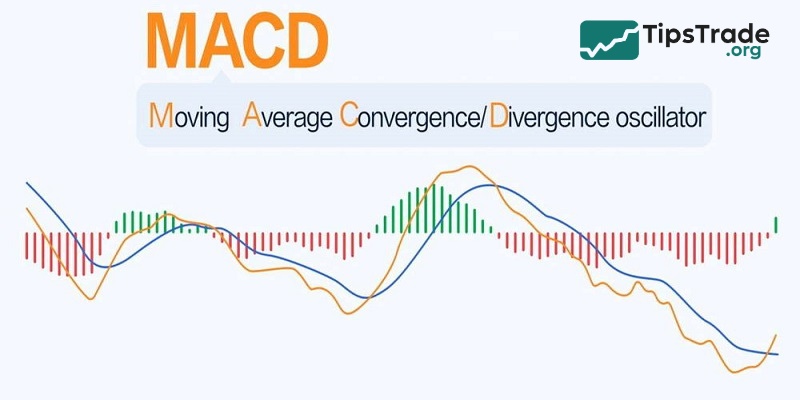
Moving Average Convergence Divergence (MACD)
The MACD indicator is one of the most popular and versatile tools on TradingView. Developed to reflect the relationship between the moving average and the MACD, it provides buy and sell signals based on convergence and divergence. This helps traders identify trends and effective entry points, especially when combined with other indicators.
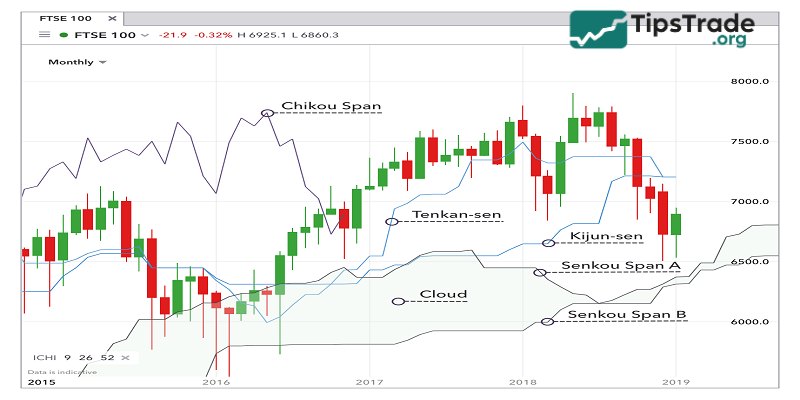
Ichimoku Cloud
The Ichimoku Cloud indicator is a complex indicator used to measure the momentum, direction, and strength of price trends. This indicator consists of 5 components: the Tenkan-sen line, the Kijun-sen line, the Ichimoku cloud, the Chikou Span line, and the Senkou Span line.
The Ichimoku Cloud indicator can help traders identify trends, support and resistance levels, and trading signals based on the intersections, crossovers, and divergences of its components. It can be used on all timeframes and markets and can be used independently or in combination with other indicators.
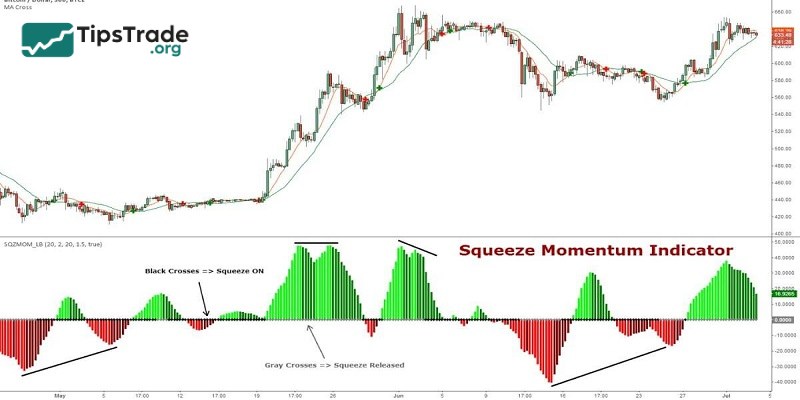
Squeeze Momentum Indicator
The Squeeze Momentum Indicator, created by LazyBear based on John Carter’s “TTM Squeeze,” provides entry and exit signals based on color changes, indicating market momentum. When a “squeeze” cycle appears, it often signals an upcoming trend, providing opportunities for traders.
Where can I find TradingView indicators?
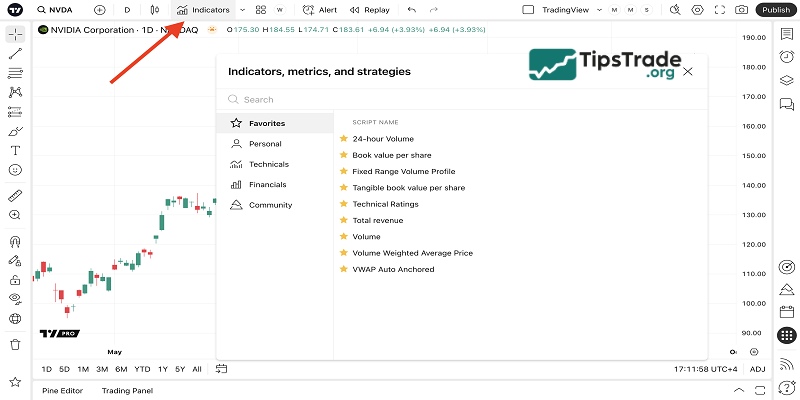
You can access the above indicators and many others in TradingView. First, bring up a chart: from the TradingView homepage, select Products in the top navigation bar, select Supercharts, and search for the financial instrument you wish to view. Then select Indicators from the navigation bar above the chart and select or search for the indicator you’d like to add to your chart. To save an indicator in your favourites tab, select the star icon to the left of the indicator.
How to choose the right indicators on TradingView
Some basic principles when choosing indicators on TradingView are:
- You should use indicators that are appropriate for the timeframe and market you are trading. Some indicators may work well on longer timeframes but not be accurate on shorter ones, and vice versa. Some indicators may be suitable for markets with clear trends, but not effective in oscillating markets, and vice versa.
- You shouldn’t use too many indicators on the same chart, as that can be confusing and contradictory. The number of indicators should be limited to 3-5, and choose indicators that are complementary and diverse.
- Regularly check and test indicators before applying them to live trading. You can use the backtesting function on TradingView to test the performance of indicators in the past and adjust the parameters to suit your trading goals and conditions.
Conclusion
The above are the top 5 best indicators TradingView. Hopefully, this article will help you choose the indicators that best match your trading style. Wishing you successful trading!