

Bearish reversal candlestick patterns are a useful analytical tool that helps investors identify price movement trends in the financial markets. Let’s explore the Best bearish reversal candlestick patterns not to be missed with Tipstrade.org through the article below.
What is a bearish reversal candlestick pattern?
A bearish reversal candlestick pattern is a price chart formation that signals a potential change in market direction from an uptrend to a downtrend. It suggests that selling pressure is starting to overpower buying pressure, and prices may begin to fall after a period of rising prices.
See more:
- Top 4 most Continuation Candlestick Patterns in trading
- Top 8 powerful bullish reversal candlestick patterns you need to know
- What is a Doji candlestick pattern? Common Doji candlestick patterns in investing
- What is price action? A complete guide to price action trading from basics to advanced
How do you confirm a bearish reversal candlestick?
Bearish candlestick patterns become more reliable when confirmed by technical context. Here are key methods to confirm a bearish reversal:
- Check the trend: They matter most after a clear uptrend. Without a prior rise, a bearish pattern chart might only indicate short-term consolidation.
- Identify resistance zones: Patterns forming near resistance or supply areas have higher accuracy. For instance, a bearish engulfing at a weekly resistance zone often marks a top.
- Volume confirmation: Stronger volume during the bearish candle shows real selling pressure — a crucial confirmation.
- Combine indicators: Use RSI or MACD for divergence clues. If RSI shows overbought levels when a bearish reversal candlestick forms, the probability of reversal increases. To know more about trading indicators please read this article.
- Wait for the close: Always let the candle close before acting. Many signals fail mid-session but confirm at the close. You can also check our article about the bearish harami pattern to see how this setup forms after a strong move up and signals a slowdown before sellers take over.
Best bearish reversal candlestick patterns not to be missed
Below are the best bearish reversal candlestick patterns that often signal strong bearish reversals in the market:
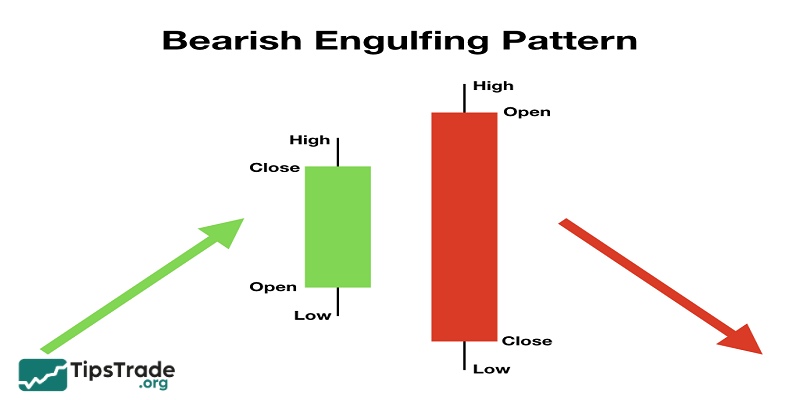
Bearish Engulfing
Conditions of the Bearish Engulfing pattern are:
- The first candle is a bullish candle, though it can also be a Doji.
- The second candle is a bearish candle with a body larger than that of the first candle.
- The real body of the second candle completely engulfs the shadows of the first candle.
In general, the Bearish Engulfing pattern is considered a Three Outside Down pattern. The difference is the presence of an additional third bearish candle, whose closing price is below the low of the second bearish candle.
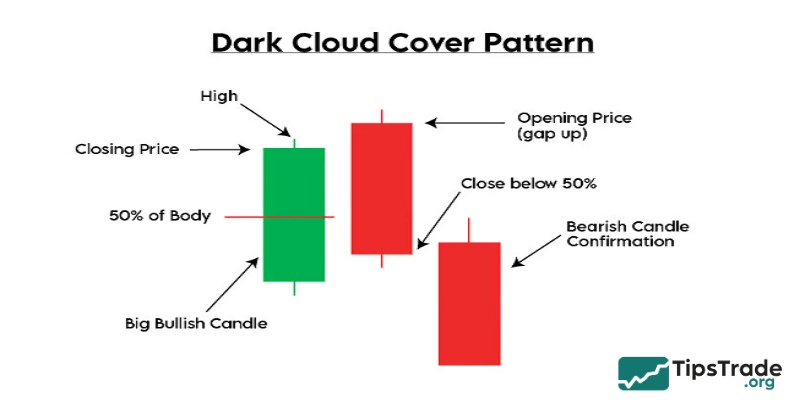
Dark Cloud Cover
Dark Cloud Cover, also known as the Bearish Piercing Line, is a candlestick pattern that signals a potential trend reversal. The first candle in the pattern is a long bullish candle, while the second candle is a bearish one that opens above the closing price of the first candle and closes below 50% of the first candle’s real body.
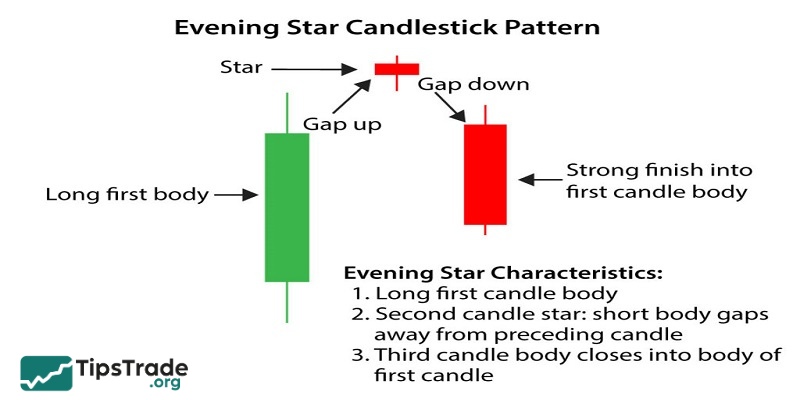
Evening Star
The first candle of Evening Star candlestick is a long bullish candle; the second candle has a small real body with an upward gap (the opening price of the second candle is higher than the closing price of the first candle); and the third candle is a strong bearish candle whose closing price falls within the real body of the first candle. The second candle may be a Doji. It is considered more reliable if there is a gap between the second and third candles.
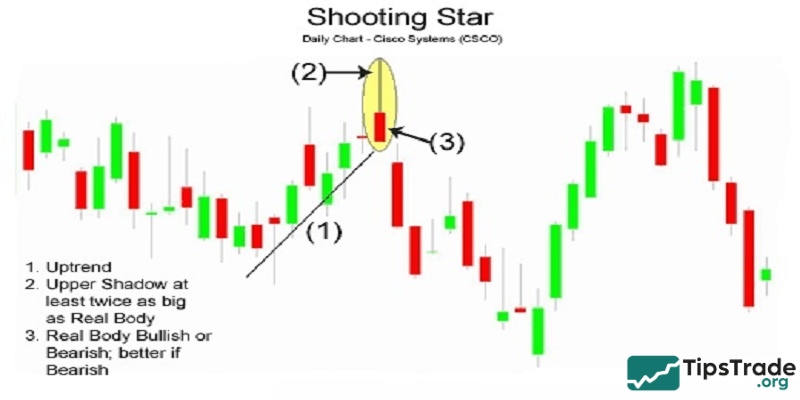
Shooting Star
The Shooting Star candlestick, also known as the Inverted Hammer, signals a potential bearish trend. In technical analysis, the Shooting Star is considered a two-candlestick formation: the first candle is a strong bullish candle, while the second candle is the actual Shooting Star.
This candlestick features a small real body located near the bottom, with a long upper shadow and a short or nonexistent lower shadow. The real body may be bullish or bearish, and the signal is stronger if the Shooting Star’s body is positioned higher than that of the previous candle. The upper shadow must be at least twice the length of the real body.
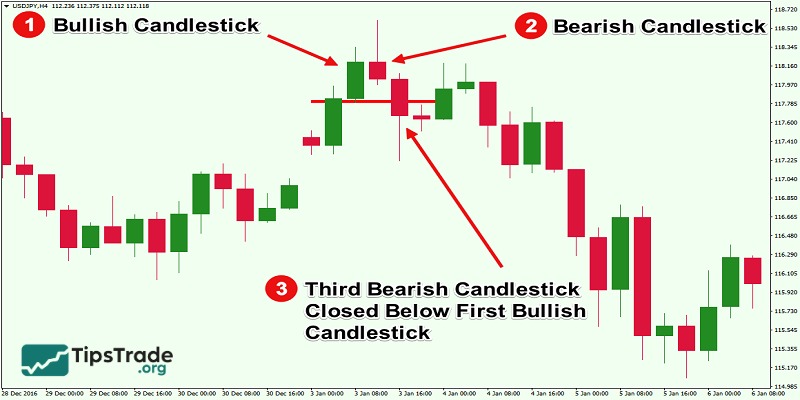
Three Inside Down
Three Inside Down is a Bearish Harami pattern that appears after an uptrend. The first candle is a long bullish candle; the second candle is a bearish candle with a small real body, whose opening and closing prices are contained within the real body of the first candle; and the third candle is a bearish candle that closes below the low of the second candle.
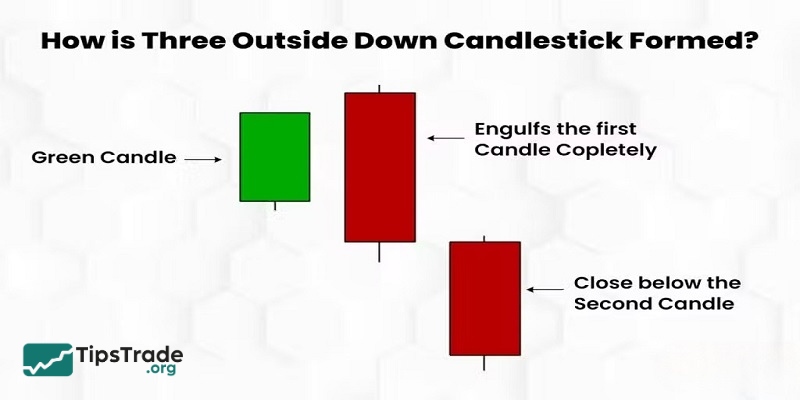
Three Outside Down
Three Outside Down is a Bearish Engulfing pattern with additional confirmation provided by a third bearish candle, which increases the reliability of the reversal signal. The market is in an uptrend. The first candle is a bullish candle with a small real body. The second candle is a bearish candle with a large real body, whose opening and closing prices are outside the real body of the first candle. The third candle is a bearish candle that closes below the low of the second candle.
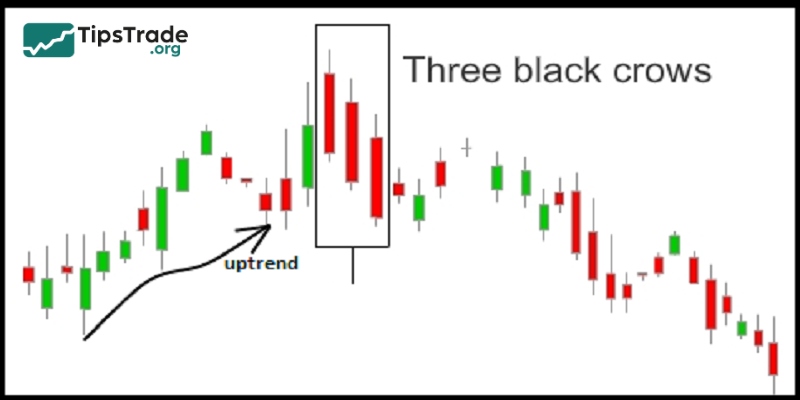
Three Black Crows
The Three Black Crows candlestick pattern appears after an uptrend. Each candle in the pattern is a bearish candle that closes near its low. The opening price of each candle is within the real body of the previous candle. A rare variation of the Three Black Crows pattern occurs when all three candles open at the same level as the closing price of the preceding candle.
Common mistakes to avoid with bearish reversal candlestick patterns
Even strong bearish reversal candlestick patterns can fail if used poorly. Avoid these pitfalls:
- Ignoring context: Patterns mean little in sideways markets.
- Skipping confirmation: Wait for the close or follow-up candle.
- Using small timeframes: Stick to 4H or Daily charts for clarity.
- Forcing patterns: Don’t call every big candle a “signal.”
- Poor risk management: Always define stop-loss and reward targets.
Conclusion
Studying strong bearish reversal candlestick patterns provides investors with a solid foundation to anticipate market trends and identify optimal entry points. Hopefully, after reading this article, you have gained more useful insights into bearish reversal candlestick patterns and can apply them successfully in your investment journey.