
Balance Sheet Analysis is a fundamental process that helps stakeholders understand a company’s financial position at a specific point in time. The balance sheet presents key elements including assets, liabilities, and equity, offering insights into liquidity, solvency, and overall financial health. Through this article, let’s explore in detail how to analyze balance sheets, interpret important metrics, and apply these insights for informed decision-making. For a deeper understanding and expert guidance, please visit tipstrade.org
Overview of the Balance Sheet analysis
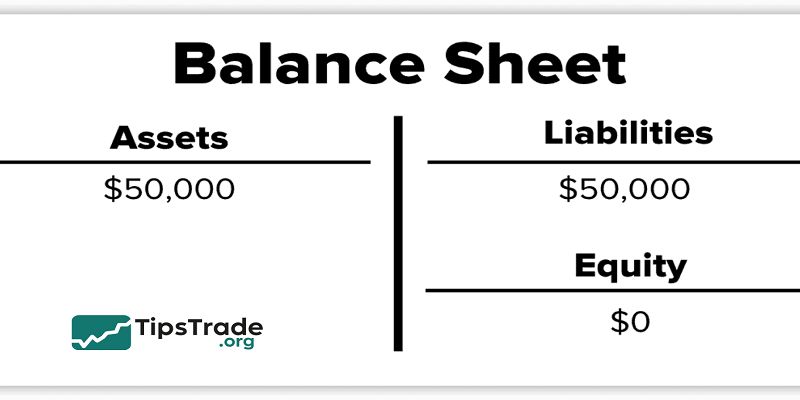
A balance sheet follows a simple but powerful formula:
Assets = Liabilities + Equity
This equation ensures that everything a company owns is financed either by borrowing (liabilities) or by shareholders’ investment (equity). The balance sheet is typically divided into two sections:
- Assets (what the company owns)
- Liabilities and Equity (how those assets are funded)
Unlike the income statement, which covers a period (e.g., quarterly or yearly), the balance sheet provides information at a specific date. Think of it like a financial “snapshot.”
A structured balance sheet generally includes:
- Current and non-current assets
- Current and non-current liabilities
- Equity components
Key Components of the Balance Sheet
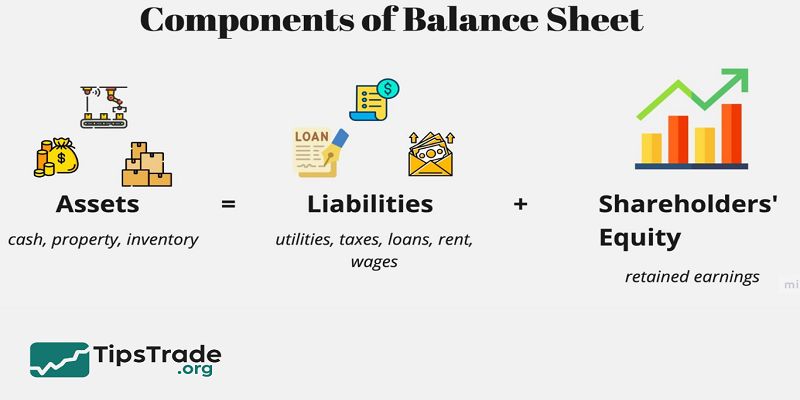
Assets
Assets represent everything a company owns that has monetary value. They are typically classified into two categories:
Current Assets – Expected to be converted into cash within a year. Examples include:
- Cash & Cash Equivalents – Highly liquid resources
- Accounts Receivable – Money owed by customers
- Inventory – Goods available for sale
Non-Current Assets – Long-term investments not easily converted to cash. Examples:
- Property, Plant & Equipment (PP&E)
- Long-term Investments
- Intangible Assets – Patents, goodwill, trademarks
Quality of assets is as important as their size. For instance, high accounts receivable may look good, but if many customers delay payments, it signals collection risks. Similarly, large inventories could suggest weak demand.
Example: A retail chain may report $50 million in inventory. If turnover is slow, analysts may question whether products are outdated or overstocked.
Liabilities
Liabilities reflect obligations that a company must settle, either in the short or long term.
- Current Liabilities – Due within a year:
- Accounts Payable
- Short-term Debt
- Taxes Payable
- Non-Current Liabilities – Long-term obligations:
- Bonds Payable
- Lease Obligations
- Pension Liabilities
Liabilities are crucial because they determine leverage and financial risk. A company heavily financed by debt may struggle during downturns if cash flows weaken.
Example: In 2008, many real estate firms collapsed because short-term debts exceeded liquid assets, making it impossible to refinance during the credit crunch.
A good balance sheet shows a healthy mix of liabilities and equity, with manageable repayment schedules and interest obligations.
Equity
Equity represents the residual interest in assets after deducting liabilities. In simple terms, it’s what shareholders own. Equity includes:
- Common Stock – Value of shares issued
- Retained Earnings – Profits kept for reinvestment rather than dividends
- Other Reserves – Additional paid-in capital or accumulated adjustments
Equity is important because it shows financial resilience. A growing retained earnings account signals that a company is reinvesting profits into growth. Conversely, shrinking equity may suggest heavy losses, excessive dividends, or aggressive buybacks.
Investor Tip: A company with consistent equity growth over five years is generally financially healthier than one with stagnant or declining equity.
Steps to Analyze a Balance Sheet

Step 1 – Analyze Assets
Start by checking the composition of assets:
- Ratio of current assets vs non-current assets
- Level of cash and equivalents compared to liabilities
- Quality of receivables (are they collectible?)
- Inventory turnover
Example: If current assets are $120,000 while current liabilities are $100,000, working capital is positive, suggesting the company can meet short-term obligations.
Step 2 – Analyze Liabilities
Evaluate the debt maturity profile:
- How much is short-term debt?
- Is long-term debt manageable compared to cash flow?
- Are there contingent liabilities (e.g., lawsuits)?
If a company’s total liabilities equal 80% of its assets, leverage is high. This may indicate growth financed by borrowing, but also raises default risk if revenues decline.
Step 3 – Analyze Equity
Look at retained earnings trends. Growing retained earnings indicate reinvested profits. Declining equity may reveal losses or aggressive dividend payouts.
Example: Coca-Cola’s balance sheet shows steady retained earnings growth, signaling stable profitability. In contrast, companies in distress often show shrinking equity due to accumulated losses.
Step 4 – Compare and Benchmark
Balance sheet analysis is not complete without comparisons:
- Trend analysis – Compare figures across 3–5 years
- Industry benchmarks – How does the company stack up against competitors?
For example, a debt-to-equity ratio of 1.5 may be alarming for a retail chain but acceptable for a utility company, which typically operates with higher leverage.
Key Financial Ratios for Balance Sheet Analysis
Liquidity Ratios
- Current Ratio: Measures the company’s ability to meet short-term obligations with its current assets.
Formula: Current Ratio=Current AssetsCurrent Liabilities
Ideal: Generally >1.5 for most industries. A ratio above 1 means the company can pay its debts due within one year.
-
Quick Ratio (Acid-Test Ratio): Measures the ability to meet short-term obligations excluding less liquid assets like inventory.
Formula: Quick Ratio=Current Assets−InventoryCurrent Liabilities
This ratio focuses on most liquid assets like cash and receivables, indicating cash strength.
A quick ratio above 1 is generally favorable.
Leverage Ratios
-
Debt-to-Equity Ratio: Indicates financial risk by comparing total liabilities to shareholders’ equity.
Formula: Debt-to-Equity Ratio=Total LiabilitiesTotal Equity
A high ratio means more aggressive use of debt financing. For example, Tesla’s early years had a D/E > 2.0, reflecting high growth fueled by debt. -
Debt Ratio: Shows the portion of assets financed by debt, measuring financial leverage.
Formula: Debt Ratio=Total LiabilitiesTotal Assets
Higher values indicate greater reliance on debt financing, which adds risk.
Efficiency Ratios
-
Inventory Turnover: Measures how efficiently inventory is managed by comparing cost of goods sold (COGS) to average inventory.
Formula: Inventory Turnover=COGSAverage Inventory -
Receivables Turnover: Assesses how effectively a company collects its receivables.
Formula: Receivables Turnover=Net Credit SalesAverage Accounts Receivable
Other Key Indicators
-
Working Capital: The difference between current assets and current liabilities, indicating short-term financial health.
Formula: Working Capital=Current Assets−Current Liabilities -
Book Value per Share: Reflects equity per outstanding share, useful for shareholder value assessment.
Formula: Book Value per Share=EquityOutstanding Shares -
Equity Multiplier: An indicator of financial leverage.
Formula: Equity Multiplier=AssetsEquity
Why Balance Sheet Analysis is Important
Balance sheet analysis reveals whether a company is financially strong or weak.
Benefits include:
- Identifying investment opportunities (low debt, strong equity)
- Spotting risks (excessive leverage, declining liquidity)
- Assessing long-term growth trends
For instance, Warren Buffett often examines balance sheets to spot undervalued companies with solid fundamentals. A business with manageable debt and high retained earnings has greater flexibility during recessions.
Practical Example: Balance Sheet Analysis
Sample Balance Sheet (Simplified):
| Item | Amount ($) |
| Cash & Equivalents | 50,000 |
| Accounts Receivable | 30,000 |
| Inventory | 20,000 |
| PP&E | 100,000 |
| Total Assets | 200,000 |
| Accounts Payable | 40,000 |
| Short-term Debt | 20,000 |
| Long-term Debt | 60,000 |
| Total Liabilities | 120,000 |
| Equity | 80,000 |
Key Ratios:
- Current Ratio = 100,000 ÷ 60,000 = 1.67
- Debt-to-Equity = 120,000 ÷ 80,000 = 1.5
- Working Capital = 100,000 – 60,000 = 40,000
Interpretation: The company has adequate liquidity but carries moderate leverage. Investors should monitor debt repayment capacity.
Limitations of Balance Sheet Analysis
While valuable, balance sheet analysis has limitations:
- Only shows data at a single point in time
- Does not reveal profitability trends (income statement needed)
- Does not show cash flow timing (cash flow statement required)
- Subject to accounting policies (e.g., depreciation, asset valuation)
Example: Two companies may own identical machinery, but if one uses accelerated depreciation, its balance sheet will show lower asset values, making comparisons tricky.
Conclusion and Recommendations
Balance sheet analysis is an essential tool for investors, entrepreneurs, and finance professionals. By examining assets, liabilities, and equity, one can uncover a company’s financial health, growth potential, and risks.
Key recommendations for beginners:
- Focus first on liquidity ratios (Current Ratio, Quick Ratio)
- Evaluate debt levels with Debt-to-Equity and Debt Ratios
- Always compare data across several years and against industry peers
- Combine balance sheet analysis with income statement and cash flow statement for a holistic view
Smart investors use balance sheet analysis not just to avoid weak companies, but also to spot undervalued gems.
Conclusion
Balance Sheet Analysis provides essential information for assessing the sustainability and financial strength of a business. Having a clear understanding of balance sheet components enables better management of assets, liabilities, and equity to improve financial performance.