
To avoid missing golden opportunities in the market, having a deep understanding of the core TradingView features is extremely important. In this article, we will explore the most powerful TradingView features that every trader, from beginners to professionals, needs to know in order to optimize their trading process and enhance their technical analysis effectiveness. What […]
Author Archives: KimHop
08
Jan
Jan
How to sign up TradingView account? TradingView is one of the most powerful charting and analysis platforms for traders and investors. With a user-friendly interface, a wide range of technical analysis tools, and the ability to integrate data from multiple exchanges, TradingView has become a top choice for the global trading community. To use this […]

07
Jan
Jan
Comparing TradingView vs MT5 reveals clear differences in functionality and target users, with TradingView excelling in charting and community features, while MT5 stands out as the leading choice for algorithmic trading and advanced backtesting. Let’s join Tipstrade.org in exploring each aspect in depth to discover the ideal trading platform that helps optimize strategies and enhance […]
07
Jan
Jan
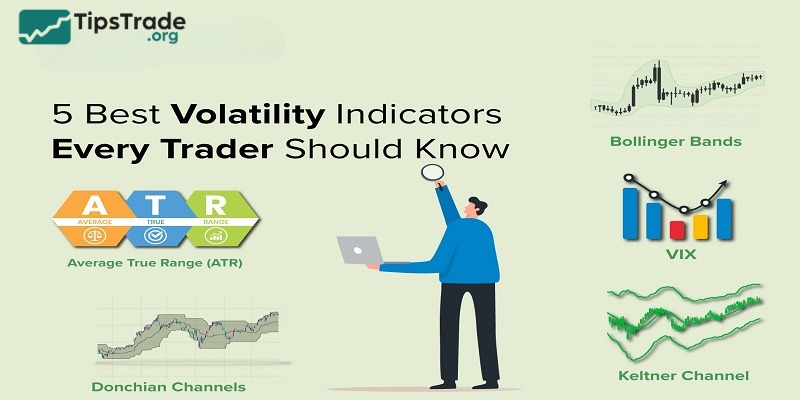
Forex volatility indicators help traders measure the degree of price fluctuation in currency pairs. From there, they can better assess risk and adjust position size. Below are the Top 5 best forex volatility indicators that traders should use in technical analysis. What are forex volatility indicators? The uses of forex volatility indicators are used to […]
06
Jan
Jan
For new traders, learning how to draw trendline MT5 accurately to “catch the pulse” of the market is a challenge. In this article, Tipstrade.org will guide you step-by-step on how to draw trendline MT5 correctly, thereby minimizing risks and optimizing profits in your trading! The importance of trendline on the MT5 platform In technical analysis, […]

06
Jan
Jan
How to backtest on MT5 is a critical skill that every serious trader needs to master before risking real capital in the market. In this article, Tipstrade.org will guide you step-by-step on how to backtest on MT5 to turn past data into future profits. Let’s get started! The reasons Pro Traders never skip backtesting on […]
05
Jan
Jan
How to code Pine Script has become an essential skill for traders and investors who use TradingView for technical analysis and strategy development. Pine Script not only allows you to create custom indicators tailored to your own trading style, but also enables strategy backtesting, alert automation, and performance optimization in a professional way. In this […]
05
Jan
Jan
Currently, both popular trading platforms TradingView vs MT4 maintain their leading positions in the global financial market. While TradingView stands out for its chart analysis capabilities, data, and community idea sharing, MT4 is a strong choice for order execution and automated trading. This article is a concise guide to both leading platforms. You’ll learn the […]
02
Jan
Jan
CFD Forex is a very familiar form of trading that anyone participating in the foreign exchange market has likely heard of; however, not everyone fully understands this concept. Having a clear understanding of what CFD Forex is, how it works, and its underlying mechanisms can be extremely beneficial for traders in the forex market. If […]
02
Jan
Jan
What is CFD? CFD trading offers the ability to profit from both rising and falling market conditions. It is considered a popular financial instrument that enables investors to access global markets. However, not everyone fully understands this concept. So, what is CFD? What are its advantages, disadvantages, and how does CFD trading work? Let’s explore […]