
To understand how to use the TradingView mobile, you first need to download the TradingView application to your device. In this article, Tipstrade.org will guide you on how to use the TradingView mobile app in the most detailed way. What is TradingView mobile? TradingView mobile is the mobile application version of the TradingView technical analysis […]
Author Archives: KimHop
15
Jan
Jan
What is TradingView? What makes this trading platform stand out, and how can you register a trading account? Below is a detailed article for all investors. What is TradingView? TradingView is an integrated toolkit designed to support investment trading. It can be regarded as a miniature social network equipped with a wide range of tools […]
14
Jan
Jan
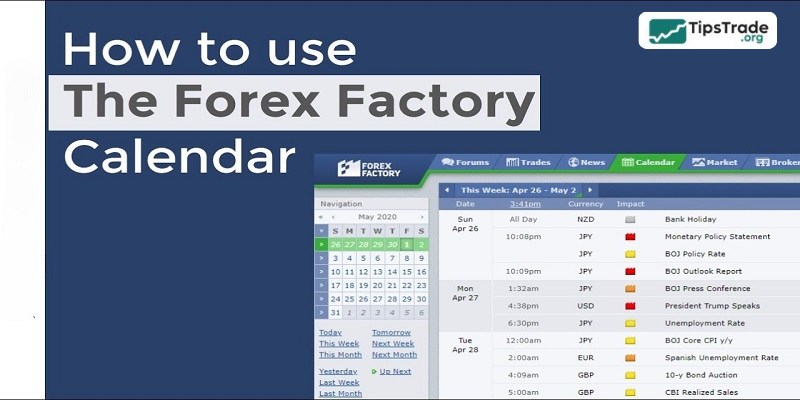
Forex Factory Calendar is considered one of the most important news analysis tools for Forex traders, especially those who follow news-based trading strategies. With its ability to provide real-time updates on economic events, financial indicators, and central bank speeches, this tool helps traders identify periods of high market volatility. So, how to use the Forex […]
14
Jan
Jan
Forex Factory Trade Explorer is one of the most powerful and transparent trading performance tracking tools available to traders today. By allowing users to connect their MT4 or MT5 accounts directly to the Forex Factory ecosystem, this tool helps traders monitor, analyze, and showcase their real trading results with ease. In this article, we will […]
13
Jan
Jan
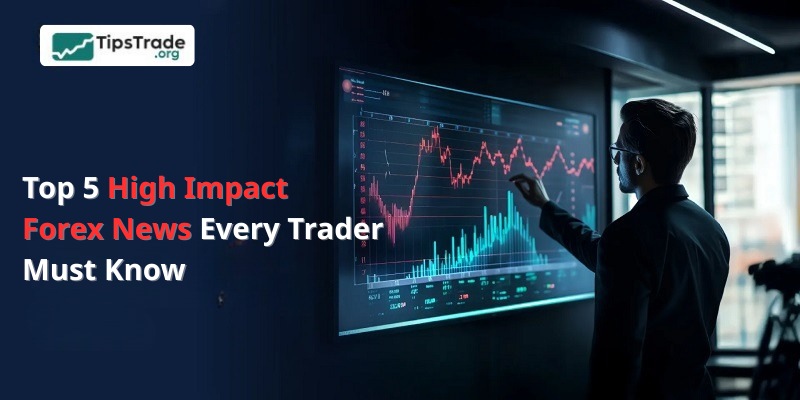
If you are a trader who follows a news-based strategy, you are likely very interested in high impact forex news. Keeping track of these important news events can help you gauge market direction and adjust your trading approach accordingly. In this article, we have compiled the essential high impact forex news you need for your […]
13
Jan
Jan
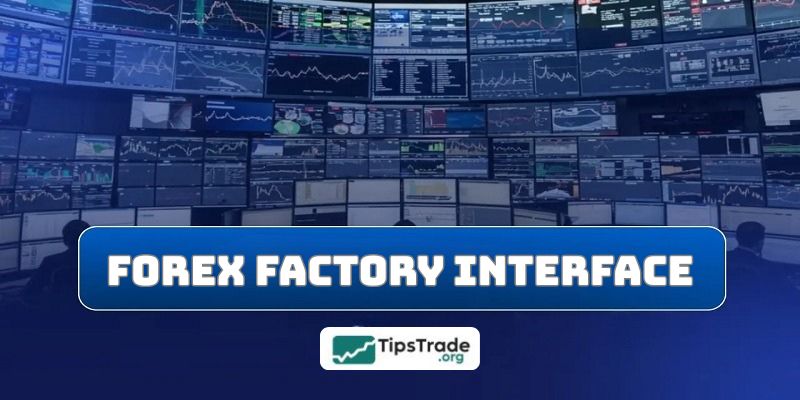
The Forex Factory interface is built on a minimalist philosophy but focuses on maximizing user experience, helping traders access market data quickly and accurately. Let’s explore the Forex Factory interface with Tipstrade.org in the article content below! Introduction to forex factory Forex Factory was founded and is operated by Fair Economy, Inc., a company specializing […]
12
Jan
Jan
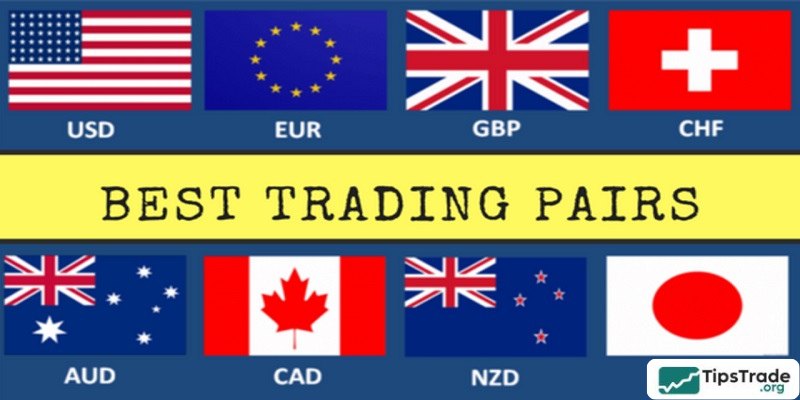
Currency trading is a popular and attractive investment method. So, what are the best currency pairs to trade for beginners? In this article, we will explore the Top 5 best currency pairs to trade for beginners today. Why do beginners need to choose the right best currency pairs to trade? Liquidity and Trading Volume The […]

12
Jan
Jan
How to use Forex Factory? As a forex trader, you’ve definitely heard of Forex Factory. Because this is a website that provides extremely valuable and useful information for traders. The content of the following article will guide you on how to use the Forex Factory effectively to enhance your trading strategy. What is Forex Factory? […]
09
Jan
Jan
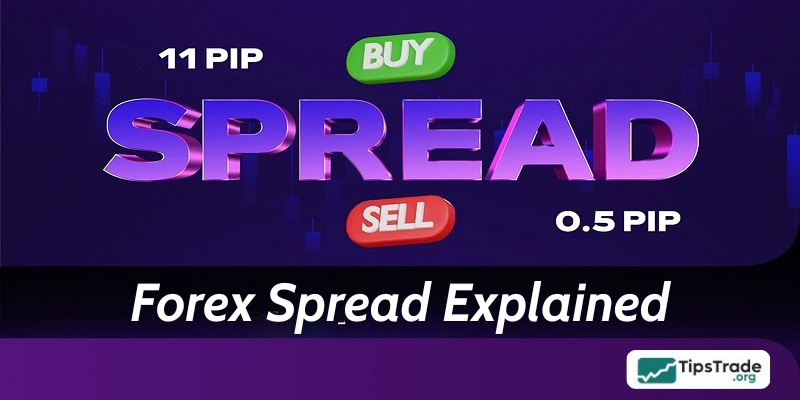
Forex spread explained is a basic concept, yet it often confuses new traders. Understanding how to calculate spreads in forex and the phenomenon of spread widening will help you control costs and avoid risks. This article will provide you with a clear and simple explanation of what spread in forex is, along with the essential […]
09
Jan
Jan
If you’re learning about what Nonfarm Payrolls are and why it has such a significant impact, as well as the NFP forex strategy that works,…The answer will be revealed right below, so stay tuned! What is the Non-Farm Payroll (NFP)? Non-Farm Payroll (NFP) explained Nonfarm, commonly known by traders as Non-Farm Payrolls (NFP), is described […]