
Add indicator to MT4 is an essential skill that every trader needs to master in order to analyze the market effectively and make informed trading decisions. MetaTrader 4 (MT4) offers a wide range of built-in technical indicators, along with the flexibility to install custom indicators that suit different trading strategies. In this article, you will […]
Author Archives: KimHop
22
Jan
Jan
Are you looking for a way to download MT4 to start your forex trading journey? In this article, Tipstrade.org will provide a detailed guide on how to download MT4. From there, helping you quickly get familiar with and master this popular trading platform. Why should traders use the MT4 trading platform? MetaTrader 4 (MT4) is […]
22
Jan
Jan
MT4 order placement is one of the most essential skills every trader needs to master when participating in the financial market. Whether you are a beginner learning the basics or an experienced trader refining your execution strategy, understanding how to place, manage, and modify orders on MetaTrader 4 can significantly impact your trading performance. In […]
22
Jan
Jan
What is a candlestick? Candlesticks are one of the most important technical analysis tools in financial trading and are widely used across markets such as forex, stocks, cryptocurrencies, and commodities. This article provides a comprehensive overview of candlesticks – from the basic concept and structure to how to read them, common candlestick patterns, and practical […]
20
Jan
Jan
TradingView stocks is one of the most popular tools for investors to monitor, analyze stocks, and make effective trading decisions. With its intuitive and user-friendly interface, TradingView is suitable for everyone from beginners to seasoned investors. This article will guide you step by step on how to use TradingView stocks to identify precise entry points […]

20
Jan
Jan
What is Forex Factory? Forex Factory is an important fundamental news website in the world of foreign exchange trading. It brings together news, statistical data, and trading support tools in a professional and transparent manner. For both beginners and experts in the forex market, this website provides essential and valuable information. This article will help […]
19
Jan
Jan
How to download MT5? MetaTrader 5 (MT5) is one of the top choices for traders, offering advanced technical analysis tools and automated trading capabilities. In this article, we will explore how to download MT5 and install it easily on computers, mobile devices, and directly on the web. How to download M5 on different devices Before […]
19
Jan
Jan
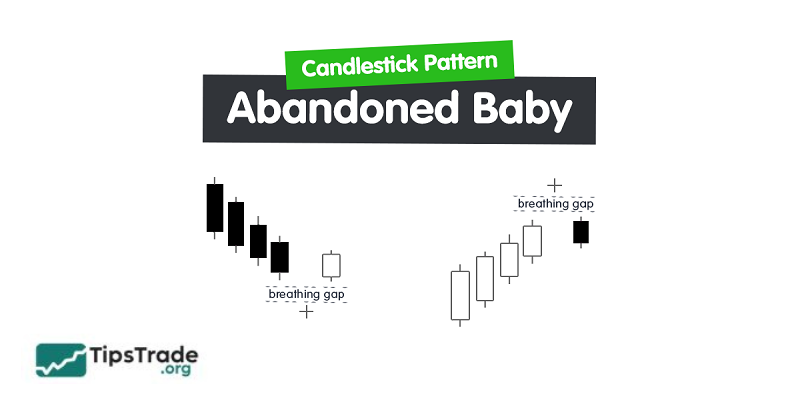
Among reversal candlestick patterns, the Abandoned baby candlestick is one of the most commonly seen and highly reliable formations. Therefore, investors who follow technical analysis need to understand it thoroughly and use it proficiently. Today, Tipstrade.org will share the key characteristics of this candlestick pattern with investors. What is an abandoned baby candlestick? Abandoned baby […]
16
Jan
Jan
VPS for MT5 is a solution chosen by traders to execute trades safely and quickly 24/7, reduce latency, and increase the success rate in the financial markets. So, what is VPS for MT5? How to install this device? Criteria for evaluating and choosing an MT5 VPS? The detailed answer will be in the article below. […]
16
Jan
Jan
MT5 is a widely used Forex and CFD trading platform, trusted by both beginner and professional traders. Understanding how to MT5 login is the first but extremely important step in managing your account, executing trades accurately, and avoiding common technical issues. In this article, Tipstrade.org will provide a detailed guide to MT5 login on different […]