The Doji candlestick pattern is one of the Japanese candlestick patterns that is no longer unfamiliar to traders when conducting technical analysis in financial markets. Let’s join Tipstrade.org to explore what the Doji candlestick pattern is and learn about the most common types of Doji patterns so you can apply them effectively in the article […]
Author Archives: KimHop
Price action is a trading method that is simple yet effective. So, what is price action, and should you trade using the price action method? Let’s explore this trading method together in the article below. What is price action? What is price action? Price action is a fundamental trading method that any trader needs to […]
How to install EA on MT4 is a topic that attracts a great deal of attention from traders, especially as automated trading becomes more popular. Installing an Expert Advisor correctly not only helps you maximize the power of your trading robot but also improves performance, reduces errors, and ensures your strategy is executed accurately. In […]
MT5 risk management is the core factor that helps traders protect their accounts and maintain sustainable profitability in the financial market. While MetaTrader 5 offers a wide range of powerful tools, understanding and applying effective risk-management strategies is the key to long-term survival. This article will walk you through the most optimal methods to minimize […]
Knowing how to place MT5 orders is an essential skill for any trader who wants to take advantage of short-term market movements and maximize their trading potential. Let’s explore the step-by-step process of placing an order on MT5 with Tipstrade.org in the article below! Detailed guide on how to place MT5 orders Download MT5 Before […]
Amidst the “matrix” of thousands of support tools on the MetaTrader 4 platform, which MT5 technical indicator is truly effective in helping you make a profit? Let’s explore the details together with Tipstrade.org in the article below. Overview of MT5 technical indicator MT5 technical indicators are technical analysis tools used on the MetaTrader 5 platform […]
To understand how to use MT4 on mobile devices, you first need to download the MT4 application to your device. In this article, Tipstrade.org will provide a detailed guide on using MT4 on mobile for Android and iOS. Let’s get started! Overview of MT4 What is MT4? MT4, fully known as Metatrader 4, is software […]
What is MQL4? In the complex and risky world of financial markets, the ability to optimize trading performance is the decisive factor between success and failure. With the continuous development of technology, automated programming is becoming a powerful tool. Among them, MQL4 cannot be overlooked. So what is MQL4? Let’s explore in detail with Tipstrade.org […]
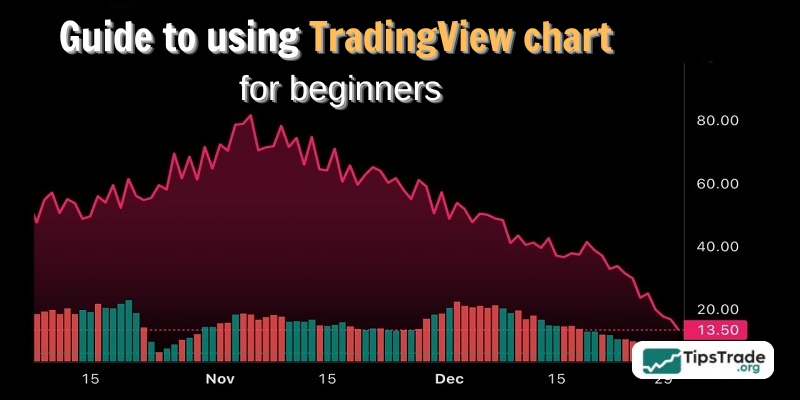
TradingView chart is one of the most extremely useful technical analysis tools for traders. This article from Tipstrade.org will guide you on how to use TradingView chart effectively to make informed trading decisions. Let’s get started! What is TradingView? TradingView is a platform and web application launched in 2011, designed for chart analysis and the […]
What are the best indicators TradingView? TradingView is an excellent tool for traders, as it offers a wide range of technical indicators for market analysis. However, not every indicator will suit your trading style. So, which indicators should you choose to achieve the best results? Don’t worry, Tipstrade.org has compiled the top 5 best indicators […]


