
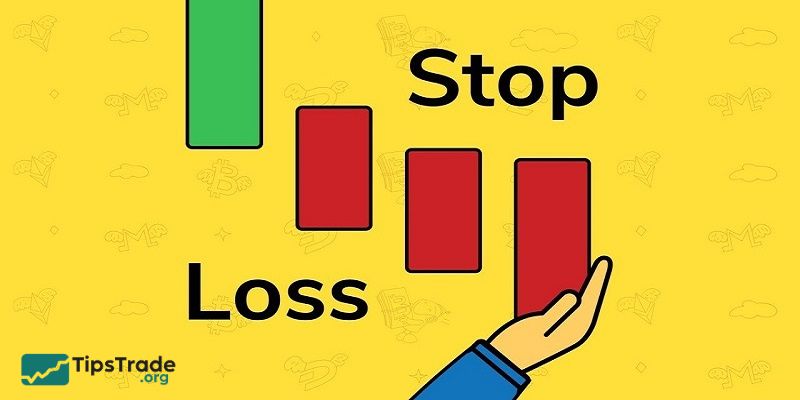
Stop loss in CFD trading is considered an essential tool for protecting capital and minimizing risk. So, what is stop loss in CFD? How to set it effectively? Let’s explore it together with Tipstrade.org in the article below! What is stop loss in CFD? Stop Loss in CFD (abbreviated as SL) is a type of […]
Author Archives: KimHop
26
Feb
Feb
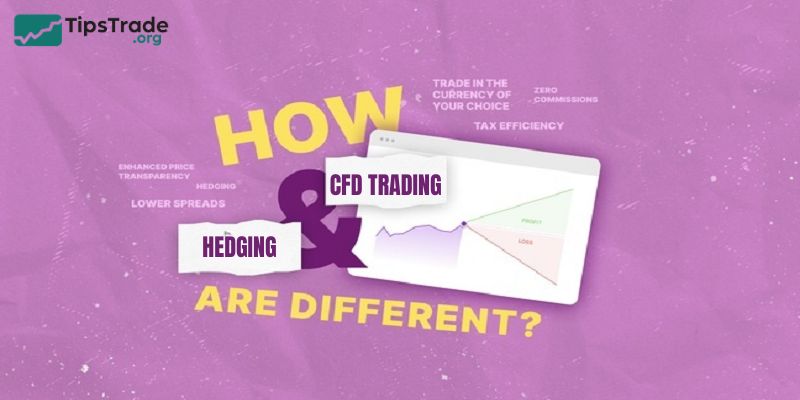
In today’s highly volatile financial markets, the keyword hedging vs CFD has become increasingly popular among investors who want to better understand risk management and profit optimization strategies. So, the article below will provide you a detailed analysis of hedging vs CFD, compares their core differences, evaluates their advantages and disadvantages, and explains how to […]
25
Feb
Feb
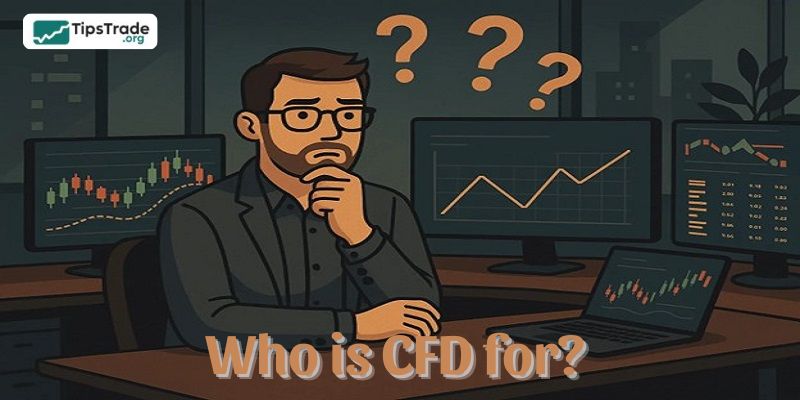
Who is CFD for? This is one of the most important questions traders should ask before entering the world of Contract for Difference trading. In this article below, we’ll break down exactly who CFDs are designed for and whether this market truly matches your trading style, experience level, and risk tolerance. Understanding CFD trading before […]

25
Feb
Feb
Are CFDs legal? This is one of the first questions most investors ask before entering the world of Contracts for Difference trading. This article will help you understand the legal status of CFDs worldwide, how financial authorities regulate this product, and what essential factors you should consider before opening a trading account. What are CFDs […]
24
Feb
Feb
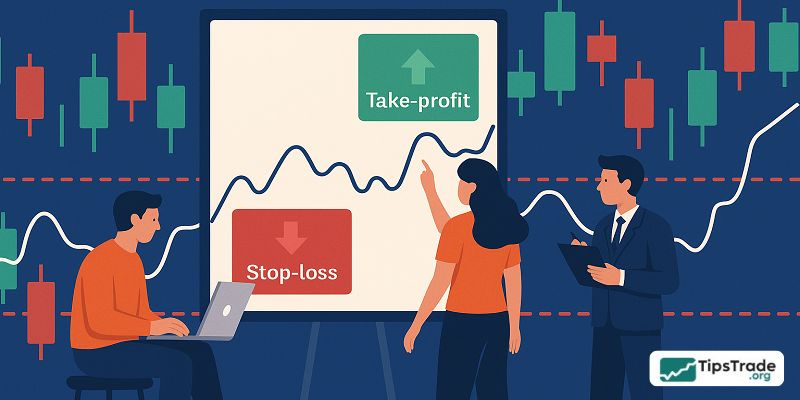
CFD Take Profit and Stop Loss are two important orders that most beginners entering the Contract for Difference market should not overlook. During the trading process, these two orders are effective tools that help investors determine appropriate exit points. The article below will walk you through what CFD Take Profit and Stop Loss orders are, […]
24
Feb
Feb
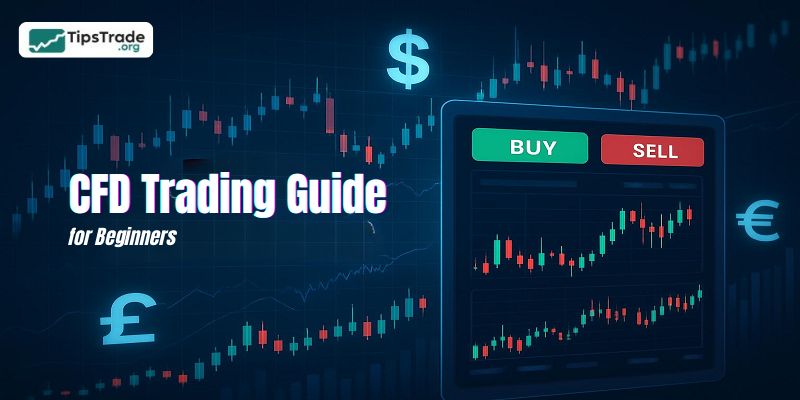
If you are looking for a complete CFD trading guide, the content of the article below will guide you through everything you need to know – starting with an explanation of what CFD trading is? Advantages, disadvantages, and how CFD trading works. Let’s get started! What is CFD trading? Before delving into the details of […]
23
Feb
Feb
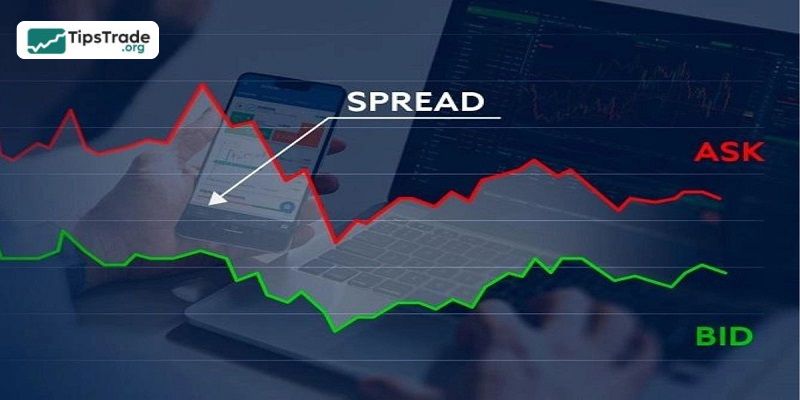
CFD spread is one of the most important factors determining trading costs and actual profitability. Many beginners focus heavily on leverage, potential returns, or trading strategies while overlooking spread – a “hidden” cost that appears the moment a position is opened. In this article, we will explore what CFD spread is, how to calculate it, […]
23
Feb
Feb
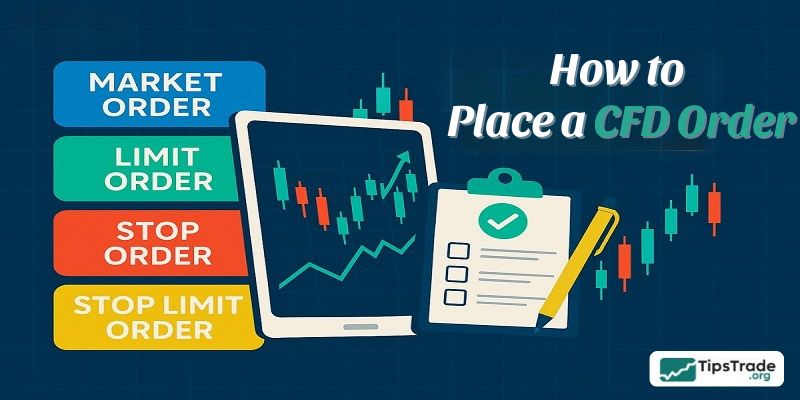
If you are new to trading, learning how to place a CFD order correctly is one of the most important skills you must master. A well-placed order not only determines your entry price but also directly impacts your risk exposure, profit potential, and overall trading discipline. This article will guide you through the detailed process […]
13
Feb
Feb
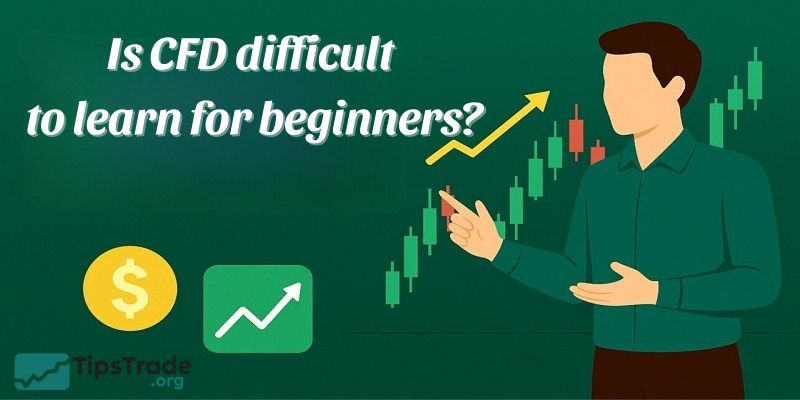
The question “Is CFD difficult?” is a common concern for many people, especially new traders when they first start trading Contracts for Difference. To answer this question, let’s explore a detailed explanation with Tipstrade.org in the article below! Understanding the basics of CFD trading Before delving into the analysis of “Is CFD difficult?“, let’s first […]

13
Feb
Feb
CFD vs Spread Betting is a common topic that many traders research before starting their trading journey. Both methods allow traders to speculate on price movements without owning the underlying assets, while also offering leverage and the ability to trade in both rising and falling markets. However, each trading method has unique characteristics in terms […]