
MACD vs RSI are two very popular momentum indicators. Thanks to their ability to provide reliable trading signals, MACD vs RSI are also frequently used together in trading strategies. So, what is the relationship between these two indicators? What are the differences between MACD vs RSI? And which indicator is better for your trading strategy? […]
Author Archives: KimHop
05
Mar
Mar
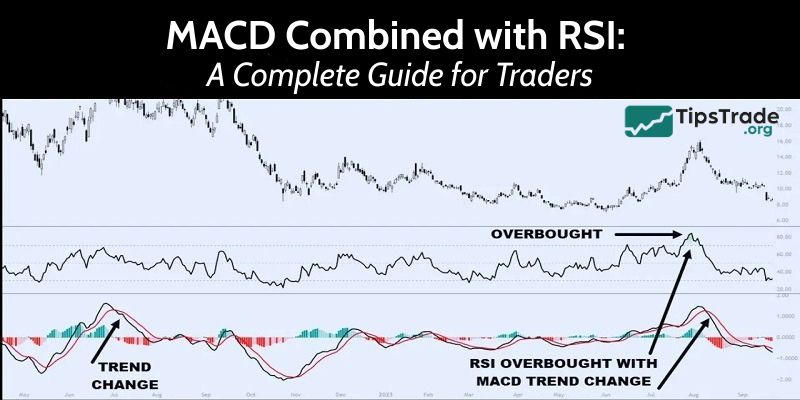
How to use MACD combined with RSI in trading? Both MACD and RSI are widely used technical indicators in financial market trading thanks to their ability to provide clear signals. So, how exactly is the MACD combined with RSI strategy implemented? Let’s explore the details with Tipstrade.org below! What is the RSI indicator? RSI indicator […]
04
Mar
Mar
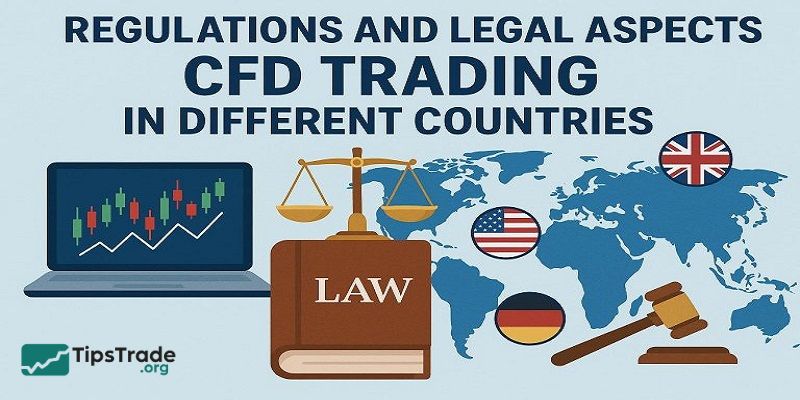
CFD regulations play a crucial role in shaping how traders access and participate in global financial markets. As Contracts for Difference (CFDs) continue to grow in popularity, governments and financial authorities around the world have introduced different regulatory frameworks to protect retail investors, control leverage, and maintain market stability. However, the rules governing CFD trading […]
04
Mar
Mar
What is technical analysis in CFD trading? You may have come across this term when learning about financial markets, especially contracts for difference. It is not just a technical concept, but also a powerful tool that helps traders forecast price trends and make informed trading decisions. In this article, Tipstrade.org will help you gain a […]

03
Mar
Mar
CFD (Contract for Difference) trading is becoming increasingly popular. So, what are the advantages of CFD trading? What are the potential risks? Let’s explore with Tipstrade.org to make the best decisions for ourselves! Characteristics of the CFD market CFD (Contract for Difference) is a financial derivative that allows traders to speculate on the price movement […]
03
Mar
Mar
Becoming a successful and consistently profitable CFD trader is far from easy. In addition to time, effort, and experience, you must also avoid certain common CFD trading mistakes throughout your trading journey. Of course, making mistakes is inevitable, and they can serve as valuable learning opportunities that help you grow and improve. Take a moment […]
02
Mar
Mar
Should I choose CFDs or stocks? This is a question that almost every new investor asks when they start learning about the financial market. Each offers unique opportunities and risks to investors like you. In the article below, we will dissect every aspect to help you make the most informed decision. Understanding CFD and stock […]

02
Mar
Mar
If you are feeling overwhelmed by the hundreds of trading platform options currently available on the market, this article will compile the Top 5 reputable CFD trading platforms based on the strictest criteria, including user interface, costs, features, and more. Through this comprehensive evaluation, you will be able to find a suitable trading platform to […]

27
Feb
Feb
In CFD trading, spread and commission fees are the two most common charges that every trader encounters. Analyzing the differences between spread and commission fees not only helps you optimize profits but also enables you to choose the right account type that aligns with your trading style. So, how do spread and commission differ, and […]

27
Feb
Feb
When it comes to CFD trading, the choice between scalping vs day trading is a crucial decision that can significantly impact your success and trading lifestyle. Both trading styles have their merits, but understanding their nuances is essential for aligning your trading approach with your goals, risk tolerance, and available time commitment. In this guide, […]