

The quick ratio holds significant importance in corporate and organizational finance, as it helps assess a company’s ability to promptly and flexibly meet its short-term obligations without relying on inventory. Let’s explore this financial metric in detail in the following article! What is the quick ratio? The quick ratio, also known as the Acid test […]
Author Archives: KimHop
14
Nov
Nov
ROA, or Return on Assets, is an important metric that provides investors with essential information to make informed investment decisions. So, what is ROA? What does it signify? How is return on asset calculated? Let’s explore this in the article below with Tipstrade.org! What is ROA? ROA (short for Return on Assets) is a financial […]
13
Nov
Nov
The current ratio is an important financial metric in corporate financial analysis. Let’s explore what the current ratio is and how to calculate it in financial analysis with Tipstrade.org in the following article! What is the current ratio? The current ratio (or working capital ratio) is a type of liquidity ratio that measures a company’s short-term solvency. […]

13
Nov
Nov
Liquidity ratios are among the important financial metrics that economists need to consider when assessing a company’s financial capacity. In this article, we will examine the most common liquidity ratios and explain how they apply in real-world situations. What are liquidity ratios? Liquidity ratios are financial metrics that indicate a company’s ability to repay short-term […]
12
Nov
Nov
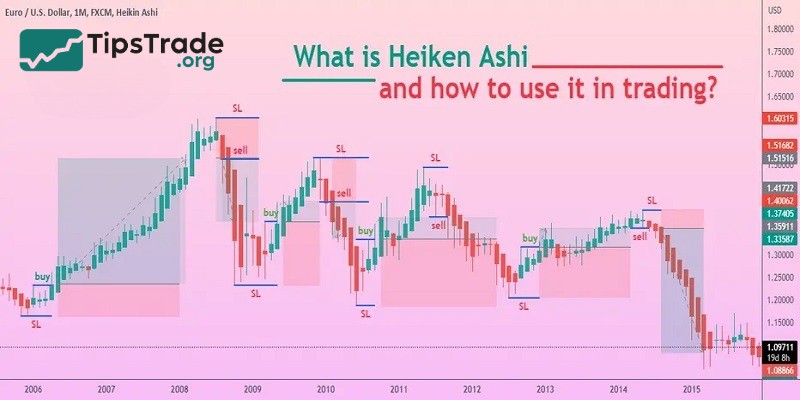
The Heikin-Ashi chart, along with Japanese candles, are two types of price candles developed by the Japanese. The Heikin-Ashi chart is an indicator, not another type of price chart. This candle has the potential to absolutely identify trends for investors to use. So, what is the Heikin-Ashi chart? What are the advantages and disadvantages of […]
12
Nov
Nov
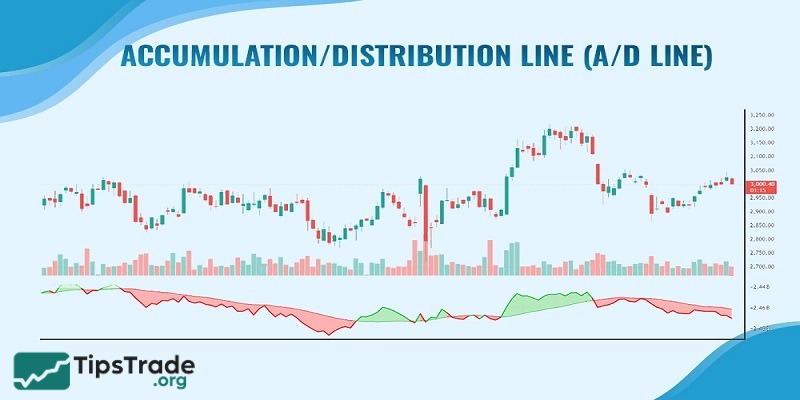
The Accumulation/Distribution line is considered a variant of the OBV indicator. It allows traders to identify buying and selling pressure in the market while also spotting reliable trend reversal points. So, what exactly is the A/D line, and how to use it in trading for getting trading signals? Let’s explore it in more detail in […]
11
Nov
Nov
Indicator combination to help traders understand and control the market. Relying solely on a single indicator can lead to unconfirmed signals and increased risk. According to Tipstrade.org, combining multiple indicators will help reduce and increase the win rate, laying the foundation for the first orders. The following article will provide detailed instructions on how to […]
11
Nov
Nov
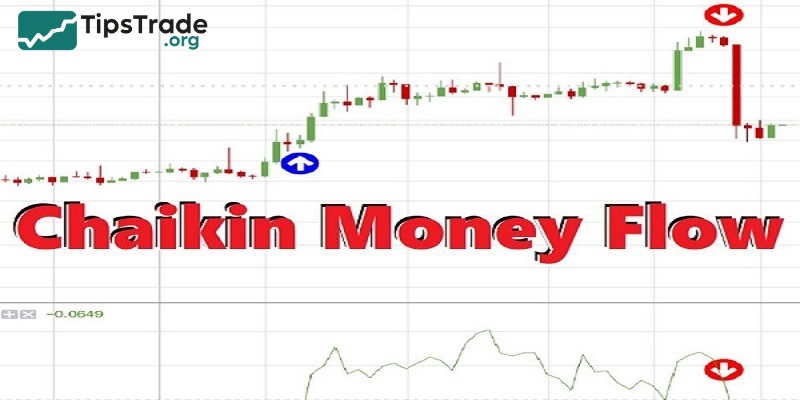
Chaikin Money Flow (CMF) is a technical indicator used by many investors to identify buying and selling pressure and find reasonable entry points. So, what exactly is Chaikin Money Flow? How is it calculated? And how can you trade effectively using this indicator? All these questions will be answered in today’s article by Tipstrade.org. Let’s […]
10
Nov
Nov
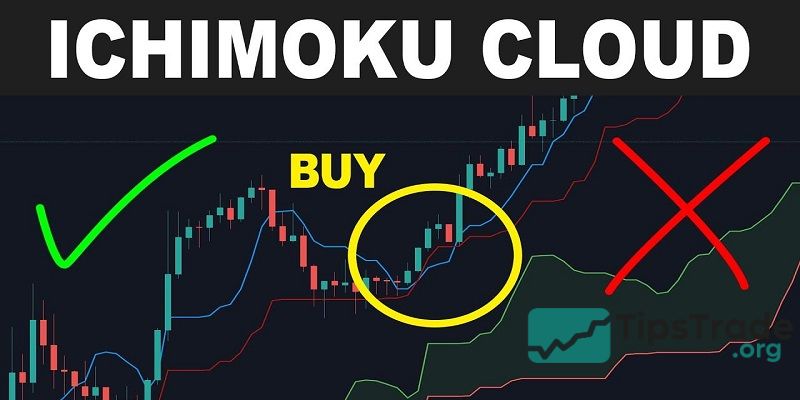
Are you wondering what the Ichimoku indicator is and why it’s used by many traders around the world? Ichimoku Kinko Hyo is one of the powerful technical analysis tools that helps investors visually identify trends, support and resistance zones, and trading signals. This article will explain in detail what Ichimoku is, its components, and how […]
10
Nov
Nov
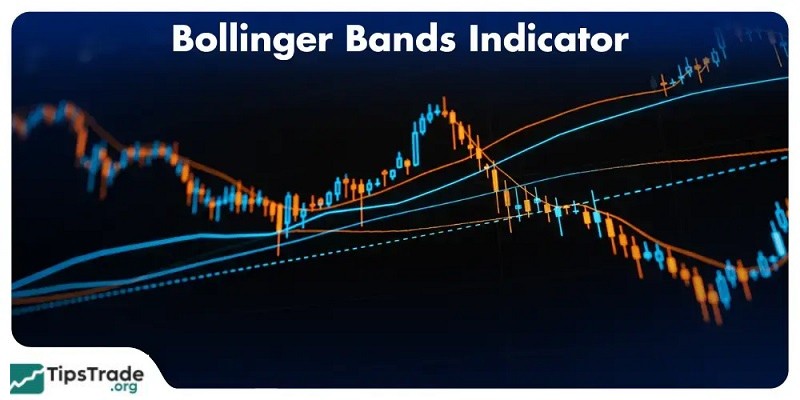
Bollinger Bands are a technical indicator that “F0” investors should learn about. This technical indicator is not complex, and its effectiveness is no less than that of other indicators. So, what are Bollinger Bands? How are the parameters in Bollinger Bands calculated? How to use the indicator will be covered in the following article! What […]