
WMA (Weighted Moving Average) is a type of moving average that takes recent price levels into account and applies weighting in its calculation. For many traders, this feature is both useful and more effective in practice. If you are unfamiliar with or not confident about this technical indicator, today’s article will help you better understand the Weighted Moving Average indicator and how to apply it in trading.
What is the WMA indicator?
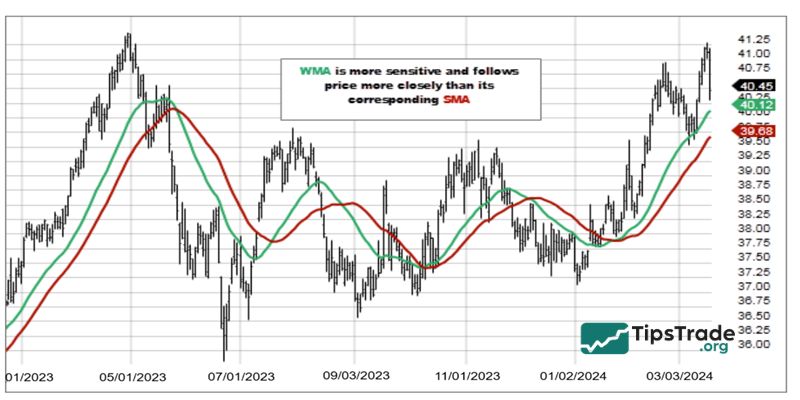
WMA (Weighted Moving Average) is a technical analysis tool used to calculate the average price of a security over a specific period of time. The key distinction of the Weighted Moving Average is that it assigns greater weight to the most recent price data. As a result, the Weighted Moving Average reacts more quickly to new price changes compared to other moving averages such as the Simple Moving Average (SMA).
At first glance, the Weighted Moving Average appears as a curved line that follows the price chart. However, at a deeper level, it is more than just a simple averaging calculation. WMA reflects the market’s belief that today’s information is more important than yesterday’s. By prioritizing the most recent trading sessions, the Weighted Moving Average attempts to capture the current market sentiment and momentum more accurately. It helps traders filter out the noise from older price data and focus on what is truly happening in the market at the present moment.
In technical analysis, the Weighted Moving Average has several important applications:
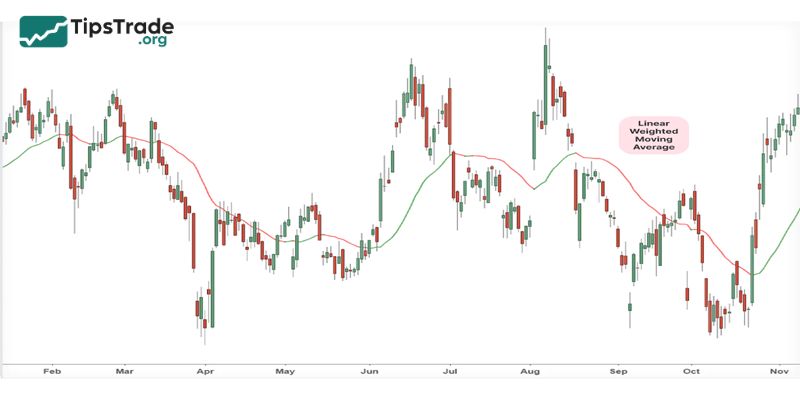
- Trend identification: The slope of the Weighted Moving Average indicates the primary direction of the market. An upward-sloping WMA signals an uptrend, while a downward-sloping line suggests a downtrend.
- Generating trading signals: Crossovers between the price and the Weighted Moving Average, or between two WMAs with different periods, can create potential buy or sell signals.
- Measuring momentum: Due to its high sensitivity, the Weighted Moving Average can help detect changes in market momentum earlier than many other indicators.
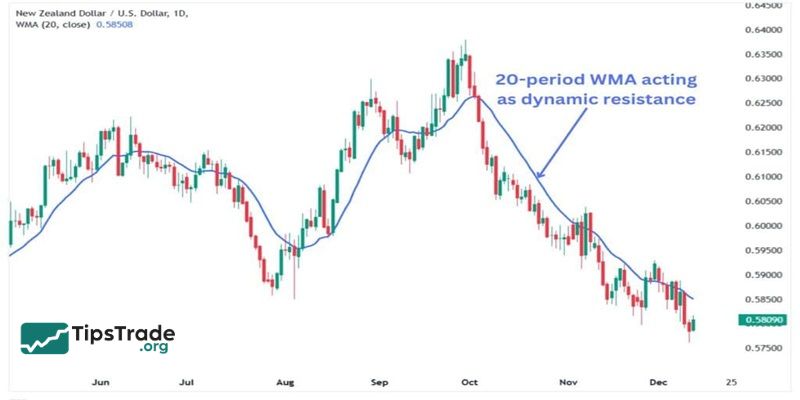
- Dynamic support and resistance: In a clear trend, the Weighted Moving Average often acts as a dynamic support level (in an uptrend) or resistance level (in a downtrend).
By understanding this nature, investors can use the Weighted Moving Average not only as a lagging tool that follows price movements, but also as a leading indicator that helps anticipate potential changes in market behavior. It is particularly useful for short-term and medium-term traders who need to respond quickly to price fluctuations.
How to calculate the Weighted Moving Average
The calculation for a weighted moving average involves a few steps that give more importance to recent data. Here is a general way to calculate it:
- Choose a period: First, decide on the number of periods to include in the average (e.g., 10 days).
- Assign weights: Assign a weight to each period. More recent data receives stronger weighting, while older entries hold progressively less value. For a 10-day period, the most recent day (Day 10) would have a weight of 10, the day before (Day 9) a weight of 9, and so on, down to the first day (Day 1) having a weight of 1.
- Sum the weights: Add all the weights together to get a denominator. For a 10-day period, this would be: 10 + 9 + 8 + 7 + 6 + 5 + 4 + 3 + 2 + 1 = 55.
- Multiply price by weight: For each day, multiply the price (like the closing price) by its assigned weight.
- Sum the weighted values: Add all the results from step 4 together.
- Divide: Divide the total from step 5 (the sum of weighted values) by the total from step 3 (the sum of the weights).
The general formula is:
Weighted Moving Average = (Price1 * Weight1 + Price2 * Weight2 + … + PriceN * WeightN) / (Weight1 + Weight2 + … + WeightN)
Where ‘N’ is the most recent period with the highest weight. Because of this process, the most recent prices have a much larger impact on the final average.
Applications of WMA in trading
The Weighted Moving Average is not merely a theoretical tool; it is also extremely useful when applied in real trading. Thanks to its high sensitivity to recent price movements, the Weighted Moving Average provides investors with many effective strategies for analysis and decision-making. Below are four of the most common and practical applications that you can start using right away.
Identifying market trends quickly
The most fundamental function of any moving average is to smooth price data in order to identify the primary trend. With the Weighted Moving Average, this capability is enhanced thanks to its emphasis on recent data. The Weighted Moving Average helps traders recognize trends earlier, providing an advantage when entering the market. The principle is very simple: the relative position between the price and the Weighted Moving Average, along with the slope of the Weighted Moving Average, reveals who is controlling the market.
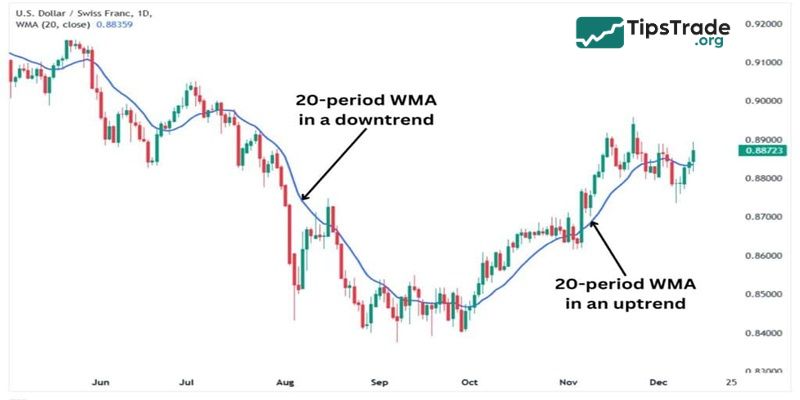
- Specifically, when the price consistently remains above the Weighted Moving Average and the Weighted Moving Average is sloping upward, it confirms a strong uptrend.
- Conversely, when the price stays below the Weighted Moving Average and the Weighted Moving Average slopes downward, the market is clearly in a downtrend.
- If the Weighted Moving Average moves sideways and the price frequently crosses above and below it, the market is likely in a sideways phase with no clear trend. In such situations, traders should be more cautious and limit trend-following trades.
Finding entry/exit points with the WMA crossover strategy
The crossover strategy is one of the most common methods used to generate specific trading signals from WMA. There are two main types of crossovers: a crossover between the price and the Weighted Moving Average, and a crossover between two WMA lines with different periods. Among these, the crossover between two WMAs is generally preferred because it helps filter out more market noise.
This strategy typically uses a fast WMA (a shorter period, for example WMA 10) and a slow WMA (a longer period, for example WMA 30).
- A Buy signal appears when the fast WMA crosses above the slow WMA, indicating that short-term momentum is stronger than long-term momentum, which may signal the beginning of an uptrend.
- Conversely, a Sell signal is generated when the fast WMA crosses below the slow WMA, suggesting that the uptrend may have ended and a downtrend could be starting.
Using WMA as dynamic support and resistance
In a trending market, the WMA line not only follows the price but also acts as a flexible value zone. It is known as Dynamic Support and Resistance because it continuously adjusts according to price movements, rather than remaining fixed like horizontal lines. In an uptrend, price pullbacks often tend to move back toward the WMA line and then bounce upward again. This creates opportunities for investors to look for low-risk entry points that align with the prevailing trend.
Conversely, in a downtrend, the WMA line functions as a dynamic resistance level. The price often rebounds toward the WMA before continuing to decline. Traders can use these points to place sell orders or take profit on previously opened long positions. According to experts at Tipstrade.org, combining this dynamic support/resistance concept with reversal candlestick patterns can significantly increase the probability of successful trades.
Combining WMA with other indicators to filter false signals
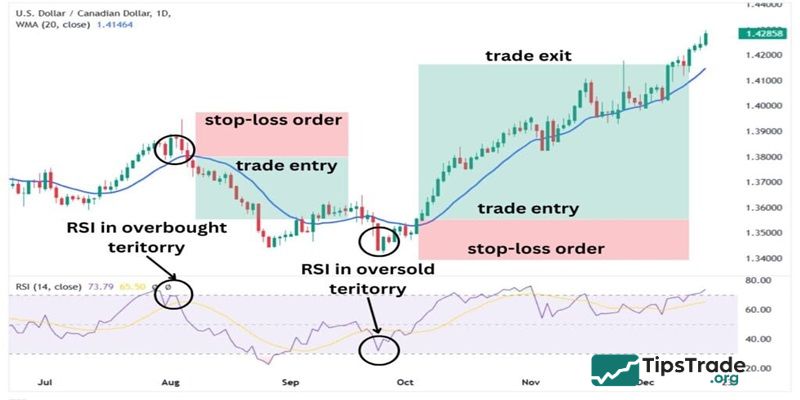
No indicator is perfect, and WMA is no exception. Due to its high sensitivity, WMA may generate many false signals (whipsaws) in a sideways market. To overcome this limitation, combining WMA with other indicators is extremely important. One of the classic approaches is to use WMA together with an oscillator such as RSI (Relative Strength Index) or MACD (Moving Average Convergence Divergence).
For example, you may receive a buy signal from the crossover of two WMA lines. Before entering the trade, you should check the RSI indicator. If RSI is already in the overbought zone (above 70), the buy signal could be a trap. On the other hand, if RSI is still in the neutral zone and moving upward, the buy signal becomes more reliable. This combination helps confirm market momentum and avoid deceptive moves, thereby improving the overall effectiveness of a trading strategy.
WMA vs SMA vs EMA: Key differences
The choice between WMA, SMA, and EMA depends entirely on the trader’s trading style, time frame, and investment objectives. Each type of moving average has its own calculation method and unique characteristics, which result in different advantages and disadvantages. Understanding these differences is the key to applying the right tool in the right situation.
To gain a clearer perspective, let’s place these three indicators side by side for comparison:
| Criteria | WMA (Weighted Moving Average) | EMA (Exponential Moving Average) | SMA (Simple Moving Average) |
|---|---|---|---|
| Weighting Method | Assigns linearly decreasing weights to older data. | Assigns exponentially decreasing weights while still considering all historical data. | Assigns equal weight to all data points within the period. |
| Price Sensitivity | Very high. Responds the fastest to recent price changes. | High. Faster than SMA but slightly slower than WMA. | Low. Responds the slowest and produces the smoothest curve. |
| Advantages | Provides the earliest signals, ideal for catching new trends. | Offers a good balance between responsiveness and smoothness, making it very popular. | Excellent at filtering noise, great for identifying long-term trends. |
| Disadvantages | More likely to generate false signals (whipsaws) in sideways markets. | Still susceptible to false signals, but less than WMA. | Signals tend to lag, which may cause traders to enter trades later. |
| When to Use | Short-term trading (day trading, scalping) where quick reactions are needed. | Medium-term trading (swing trading) and analyzing overall trends. | Long-term investing and identifying major support/resistance levels. |
In summary, there is no single “best” answer for everyone. A scalper trading on the 5-minute timeframe may find WMA extremely useful, while a value investor analyzing weekly charts might prefer the stability of SMA. EMA is often considered the balanced choice, making it suitable for the majority of traders. Professional traders commonly recommend testing all three types on a demo account to determine which one best fits your trading system and personal trading psychology.
How to set up the WMA indicator on TradingView and effective parameters
Setting up the WMA indicator on modern technical analysis platforms like TradingView is very simple and only takes a few clicks. More importantly, it’s essential to understand how to customize the parameters to fit your trading strategy. TradingView is a popular and intuitive tool, and we will guide you through the steps in detail on this platform.
To add the WMA indicator to your chart, follow these steps:
- Open the chart: Log in to your TradingView account and open the chart for the stock, currency, or asset you want to analyze.
- Access the Indicators menu: On the toolbar above the chart, click the “Indicators” (Indicators, Metrics & Strategies) button with the fx icon.
- Search for WMA: A window will appear. In the search box, type “WMA” or “Weighted Moving Average.”
- Select the indicator: From the results list, choose “Weighted Moving Average” from the built-in indicators. Click it, and the indicator will immediately appear on your chart.
After adding the WMA, the next step is to customize the parameters. Hover over the indicator name on the chart and click the gear icon (Settings). Here, you can adjust the most important parameters:
- Length: This is the ‘n’ period in the formula and the most crucial parameter to adjust. Common values include 9, 10, 20, 50, 100, and 200.
- Source: The default is “Close” (closing price). You can change it to Open, High, Low, etc., depending on your strategy.
- Style: Here you can modify the color, thickness, and line style of the WMA for better visibility on the chart.
So, which parameters are the most effective? The answer is: there is no single setting that works for every market and every timeframe. However, some general rules apply. Short-term traders often use short-period WMAs (such as 9 or 20) to catch smaller waves. Medium-term traders may use WMA 50, while WMA 100 and 200 are typically used to identify long-term trends. Experience shows that combining two WMAs (e.g., 10 and 30, or 20 and 50) for crossover signals often provides the best results.
Conclusion
Above are the basic concepts of what the WMA indicator is. Most importantly, WMA is a useful tool that helps traders identify trends and trading signals in the financial market. However, like any technical indicator, WMA is not a perfect tool and should be used with caution. Remember, no technical analysis tool is flawless or provides perfectly accurate signals. Knowledge, experience, and discipline are always crucial factors for becoming a successful trader.
See more: