
The Stochastic Oscillator is a momentum indicator that is widely used and highly effective in trading, alongside other indicators such as RSI, MACD, and more. However, many new traders use the Stochastic indicator mechanically, which can lead to misleading signals and low trading effectiveness.
This article will help you understand what the Stochastic Oscillator indicator is, how it works, the true meaning of the signals it provides, and how to apply it effectively and appropriately in trading.
What is a Stochastic Oscillator?
The Stochastic Oscillator is a momentum indicator that compares a specific closing price with its price range over a given period of time. It was developed in the early 1950s. The creator of this indicator is George Lane, a stock trader who was also a well-known public speaker.
According to Lane, the Stochastic indicator shows the position of a stock’s closing price relative to the high–low range of that stock over a certain period (typically 14 days). In many interviews, Lane often emphasized that the Stochastic indicator does not follow price, volume, or any similar factor; instead, it follows the speed or momentum of price movements. He also revealed to the press the principle behind the development of the Stochastic indicator: the speed or momentum of price always precedes the actual price movement.
See more:
- How to Use the Momentum Indicator when Trading
- The Ichimoku Indicator: What It Means and How to Use It
- Top 5 Best Types of Volume Oscillators (VO) Trader Should Know
- Bollinger Bands – An effective technical indicator for investment trading!
Stochastic Oscillator formula
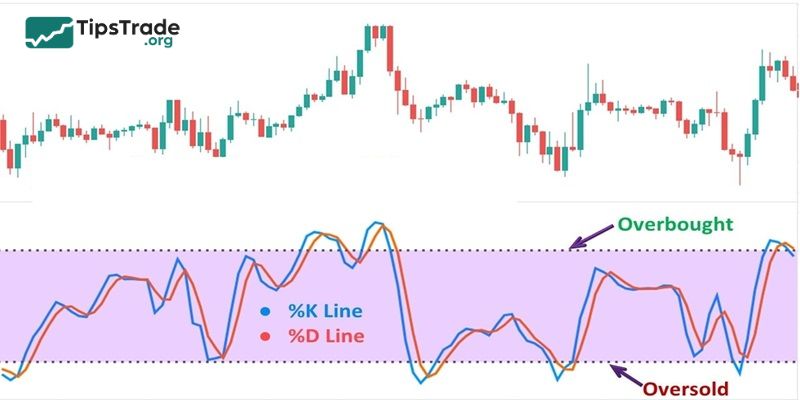
The Stochastic chart is represented by two lines: %K and %D, calculated using the following formula:
%K = [(C – L14) / (H14 – L14)] × 100
Where:
- C = the current closing price
- L14 = the lowest price over the past 14 trading sessions
- H14 = the highest price over the past 14 trading sessions
%D = the 3-period Simple Moving Average (SMA) of %K.
What does the Stochastic Oscillator tell you?
The Stochastic oscillator helps identify overbought and oversold conditions in the market.
If the Stochastic oscillator is above the 80 level, the market is considered overbought. A sell signal should only be taken when the Stochastic shows signs of turning down, meaning the %K line crosses below the %D line from above in the 80 region. Typically, when these two lines show a crossover, it indicates that the market is likely to start selling.
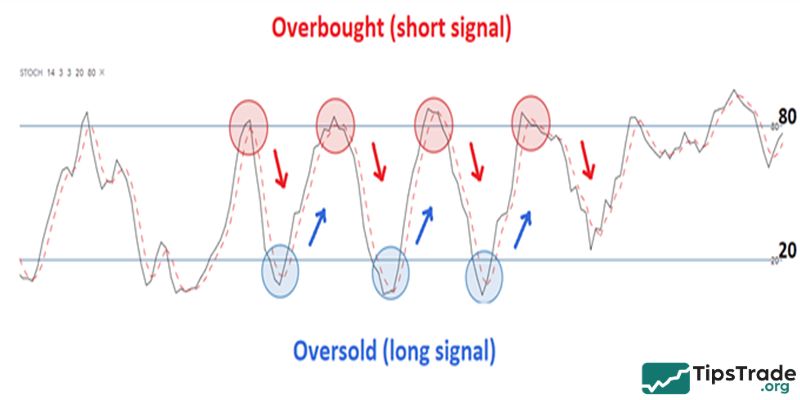
Conversely, if the Stochastic oscillator is below the 20 level, the market is considered oversold. A buy signal should only be taken when the Stochastic shows signs of turning up, meaning the %K line crosses above the %D line from below in the 20 region. Usually, when these two lines show a crossover, it signals that the market is likely to start buying.
The Stochastic oscillator is a lagging indicator (it predicts movements after the market has already moved) and is most effective in range-bound markets without a clear trend. If the market is trending, signals that follow the trend are generally more reliable. This indicator is less useful when the market is consolidating within a narrow range because the %K and %D lines may cross multiple times, producing unclear signals.
In addition to the standard 20–80 overbought–oversold levels, other commonly used ranges include 75–25, 70–30, and 85–15.
Typically, for futures markets, the default setting 5-5-5 is used, while for spot markets, 5-3-3 can be applied.
To develop an effective trading strategy with proper entry points, take-profit, and stop-loss levels, the Stochastic indicator should be combined with other oscillators and trend indicators.
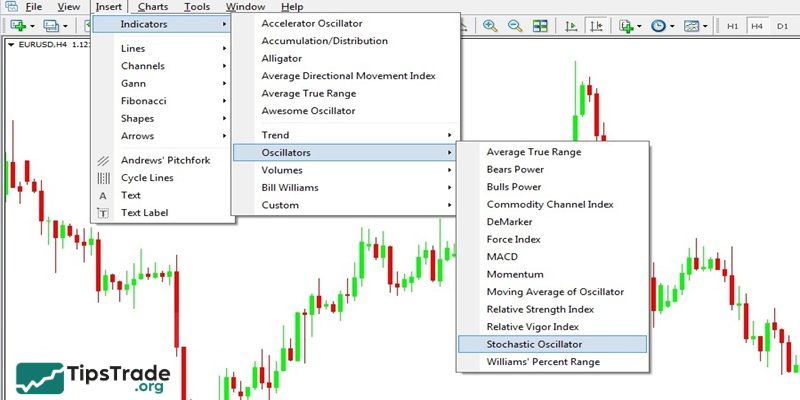
Adding the Stochastic Oscillator in MT4
Step 1- Select the Stochastic indicator in MT4: Open MT4, then go to Insert → Indicators → Oscillators → Stochastic Oscillator.
Step 2 – Configure the parameters:
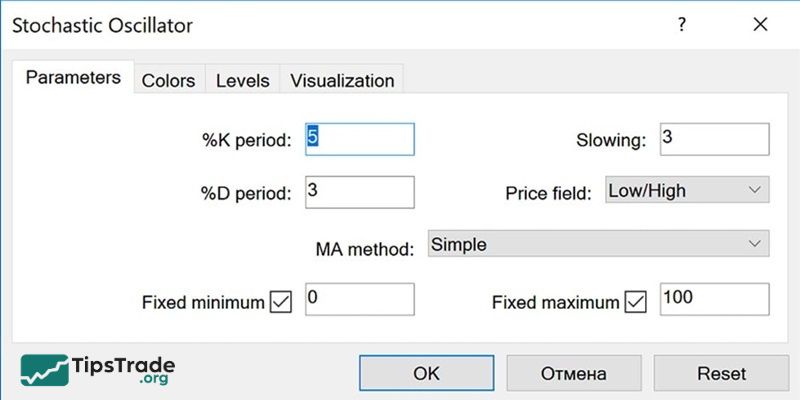
Parameters section:
- %K is the main line displayed as a solid line on the chart.
- %D is the moving average of %K.
- Price field: choose the price used for calculation, which can be the closing price, opening price, or the highest/lowest price of the candle.
Colors section: Adjust the colors for the %K and %D lines.
- %K line is the Main line.
- %D line is the Signal line.
Levels section: These are the boundary levels of the Stochastic tool.
- 20: the lower boundary, also called the oversold zone.
- 80: the upper boundary, also called the overbought zone.
Visualization section: This allows you to select the timeframes on which the Stochastic indicator will be displayed.
How to use the Stochastic Oscillator in trading
Stochastic Oscillator helps effectively identify overbought and oversold areas. But to have more accurate forecasts and reduce noise signals, traders need to combine it with other indicators or apply different methods:
Combining Stochastic Oscillator and RSI
This is one of the most popular applications based on Dow Theory (which states that price movements require a certain level of consensus, typically 12 confirmations). Both RSI and Stochastic are momentum indicators. If both indicate overbought or oversold conditions simultaneously, it presents a strong trading opportunity.
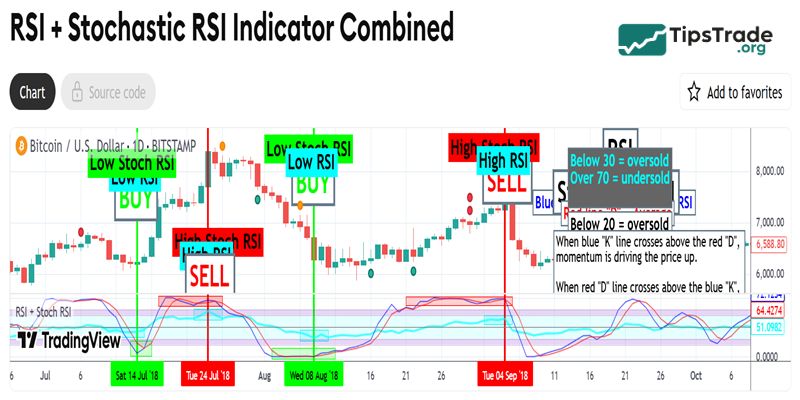
In the book “The New Technical Trader” published in 1994, authors Tushar Chande and Stanley Kroll introduced the Stochastic RSI indicator. This indicator is created by applying the Stochastic formula to a set of RSI values relative to standard price data. Using RSI values in the Stochastic formula gives traders an insight into whether the current RSI value is overbought or oversold. You can search on Google to learn more about how to use this indicator.
Combining Stochastic Oscillator with Trendlines
- For Buy Orders:
When the market is in an uptrend, draw an upward trendline and wait for the price to pull back and touch the trendline. Once the price touches the upward trendline, if the Stochastic Oscillator shows an oversold signal, this point of contact with the trendline becomes your entry point. Place your stop-loss anywhere 2–10 pips below the trendline, and set your take-profit target at the previous high.
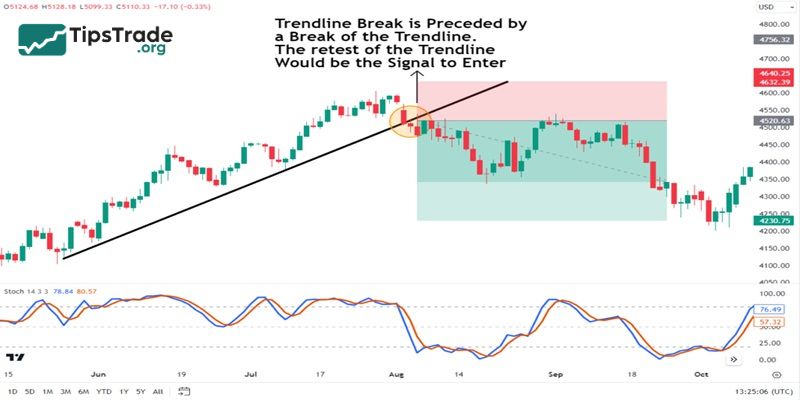
- For Sell Orders:
When the market is in a downtrend, draw a downward trendline and wait for the price to pull back and touch the trendline. At this point, if the Stochastic Oscillator shows an overbought signal, the point where the price touches the trendline becomes your entry point for selling. Place your stop-loss anywhere 2–10 pips above the downward trendline, and set your take-profit target at the previous low.
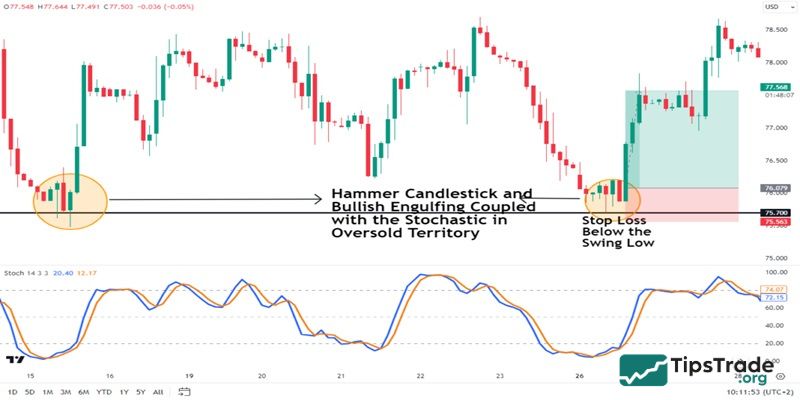
Combining Stochastic Oscillator with reversal candlesticks
Reversal candlestick patterns provide very accurate signals in financial markets such as Forex, crypto,…So, combining these patterns with the Stochastic indicator gives traders more confidence in their analysis. First, identify whether the market is in an uptrend or downtrend. Then, look for areas where a reversal candlestick pattern appears along with a Stochastic signal indicating overbought or oversold conditions. This becomes your entry point for a buy or sell order.
Combining Stochastic Oscillator with the Moving Average (MA)
The MA line is a moving average that helps identify trend endings or potential market reversals. To combine it with Stochastic, use the 200-period EMA.
- If the price is above the 200 EMA and the Stochastic is oversold, this is a good opportunity to place a buy order.
- If the price is below the 200 EMA and the Stochastic is overbought, this is a good time to place a sell order.
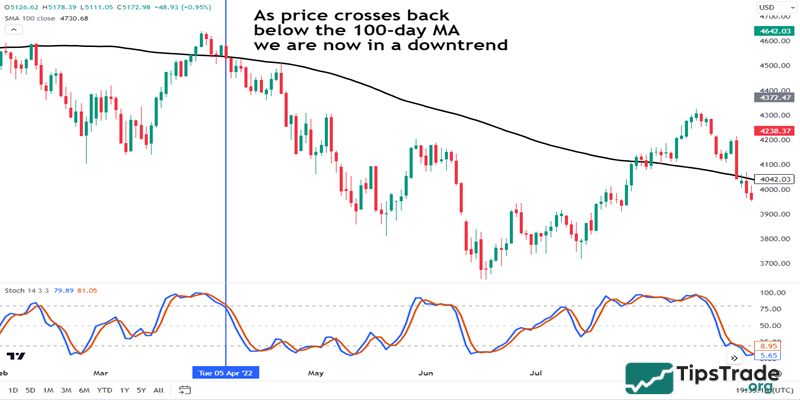
This is a trend-following strategy, so in a sideways market, many trading signals may appear, including false signals that can trigger early stop-losses if trades are not filtered carefully. To avoid this, pay attention to the angle of the 200 EMA. If the EMA is nearly flat, it is best to avoid trading to reduce the risk of losses.
Notes when trading with the Stochastic Oscillator
When using this indicator for technical analysis and trade decisions, keep in mind the following:
- Do not enter a trade immediately just because the Stochastic shows overbought or oversold conditions. Always check other indicators as well. The more indicators in agreement, the higher the probability of an accurate forecast.
- The larger the timeframe of the Stochastic Oscillator chart, the more reliable the signals.
- Trade according to the main market trend to reduce risk. This is especially important for new traders.
The Stochastic Oscillator indicator is very suitable for range-bound traders. Keep these points in mind to enter trades effectively and safely. Wishing all traders success!
See more:
- What is the CCI indicator? Formula for calculating CCI in technical analysis
- Support and Resistance: The Foundation of Price Action in Financial Markets
- Stoch RSI: An Accurate Overbought/Oversold Indicator Often Overlooked by Traders
- What is Chaikin Money Flow? Learn how to use it for measuring buying and selling pressure