
Stoch RSI is known as an extremely useful indicator for traders in financial markets. It is a technical indicator that helps traders identify market trends. So, what exactly is the Stoch RSI indicator? Let’s dive into the details on this topic with Tipstrade.org in today’s article. Let’s get started!!!
What is Stoch RSI?
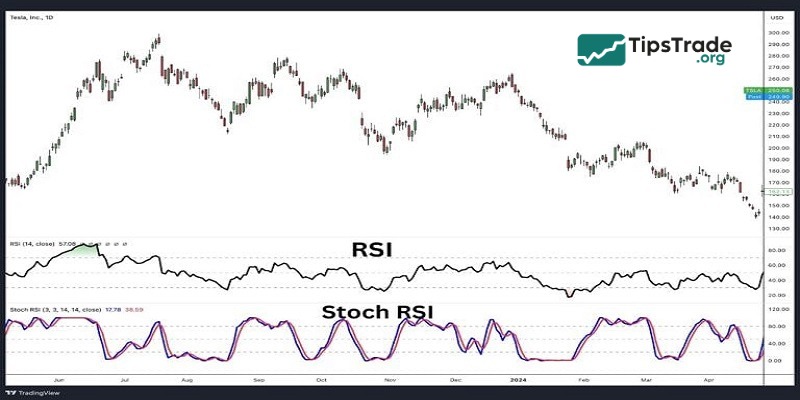
Stoch RSI, fully known as the Stochastic Relative Strength Index, is an oscillator indicator developed by applying the Stochastic Oscillator formula to the values of the Relative Strength Index (RSI). For this reason, Stoch RSI is often referred to as “an indicator of an indicator.”
The essence of Stoch RSI is that it measures the momentum of the RSI itself, rather than the price of the underlying asset directly. It shows the position of the current RSI value relative to the highest and lowest RSI values over a specified period.
Stoch RSI is an oscillating indicator, with values typically ranging from 0 to 1 (or 0 to 100 on some charting platforms). Its primary purpose is to provide earlier and more sensitive trading signals compared to the original RSI, making it particularly useful for identifying potential entry and exit points.
The Stoch RSI indicator was first introduced in 1994 by renowned technical analysts Tushar Chande and Stanley Kroll. They presented this tool in the book The New Technical Trader. Since then, Stoch RSI has become a popular tool in the arsenal of traders across many markets, from stocks and Forex to derivatives and cryptocurrencies, due to its ability to provide insight into the momentum of the RSI.
- What is the MACD Indicator and How to Use It?
- The ADX Indicator: What Is It And How To Use It?
- Moving Averages and how does it use to find the trend
- Bollinger Bands: What They Are and How to Use Them
How to calculate the Stoch RSI indicator
The formula for Stoch RSI is given by:
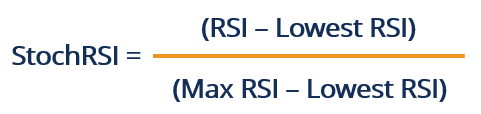
Where:
- Current RSI: The value of the RSI indicator at the present moment.
- Lowest RSI: The lowest RSI value over the last 14 trading periods (or over the period you have chosen).
- Highest RSI: The highest RSI value over the last 14 trading periods (or over the period you have chosen).
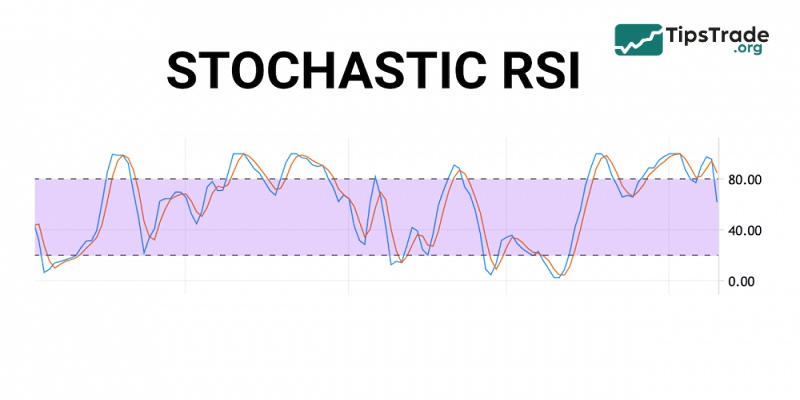
As mentioned earlier, some types of Stochastic RSI charts assign values on a scale from 0-100 instead of 0-1. On these charts, the midline is set at 50 instead of 0.5. Therefore, the overbought signal typically occurs around 0.8 (80), and the oversold signal occurs around 0.2 (20). Charts set on a 0-100 scale are interpreted in the same way.
Features of Stoch RSI indicator
The Stoch RSI was developed to improve sensitivity and generate more accurate signals compared to traditional indicators like RSI, MACD, and others.
- When the Stochastic RSI value is below 20 (0.2), the asset is considered oversold. This means the RSI is trading at a level lower than its previously defined price range.
- Conversely, when the Stochastic RSI value is above 80 (0.8), the asset is considered overbought, or the current RSI has reached an extreme high. This is a signal that the underlying asset may soon experience a price pullback.
Additionally, this indicator can be used to identify short-term trends by comparing its value to the midline at 50 (0.5):
- When the Stoch RSI is above 50 (0.5), the asset is considered to have a stronger upward trend.
- When the Stoch RSI is below 50 (0.5), the asset is trending downward.
Distinguish between Stoch RSI and RSI
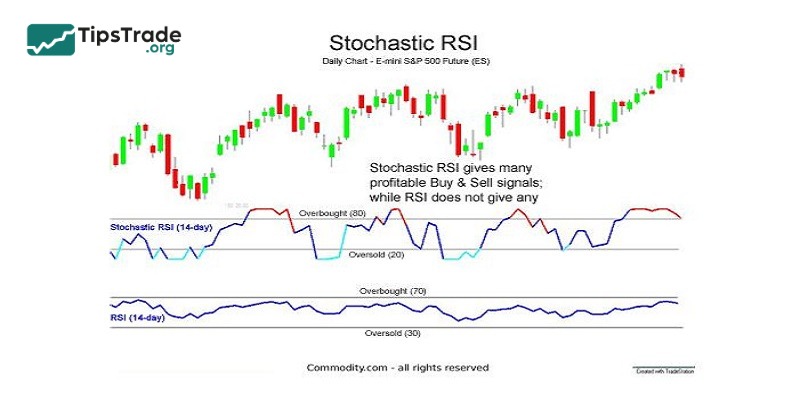
Both Stoch RSI and RSI are oscillator indicators that help traders easily identify potential overbought and oversold conditions, as well as possible reversal points. However, these two indicators are calculated using different formulas, so they naturally have some distinct differences.
Compared to Stochastic RSI, the standard RSI is a relatively slower-moving indicator and generates a smaller number of trading signals. Applying the stochastic oscillator formula to the regular RSI produces the Stochastic RSI, an indicator with higher sensitivity. As a result, it generates more signals, providing traders with more opportunities to identify market trends and potential buy or sell points.
In other words, the Stoch RSI oscillator is a more volatile indicator, making it a sharper technical analysis tool that can provide more trading signals for traders. However, more signals also mean more risk (more noise). Therefore, it is recommended to use Stochastic RSI in combination with other technical analysis tools to help confirm the signals it generates.
How to use the Stoch RSI indicator
First, the Stoch RSI indicator helps identify overbought and oversold levels within a chosen timeframe. However, at these overbought and oversold zones, you need to combine it with additional conditions to determine precise buy or sell points. Some conditions that can be combined with the Stochastic RSI include:
- Using reversal candlestick patterns in overbought and oversold zones on higher timeframes. For example, when the Stoch RSI is at 0.8, indicating an overbought area in that timeframe, you can add reversal candlestick conditions such as engulfing patterns or piercing patterns to confirm a trade signal.
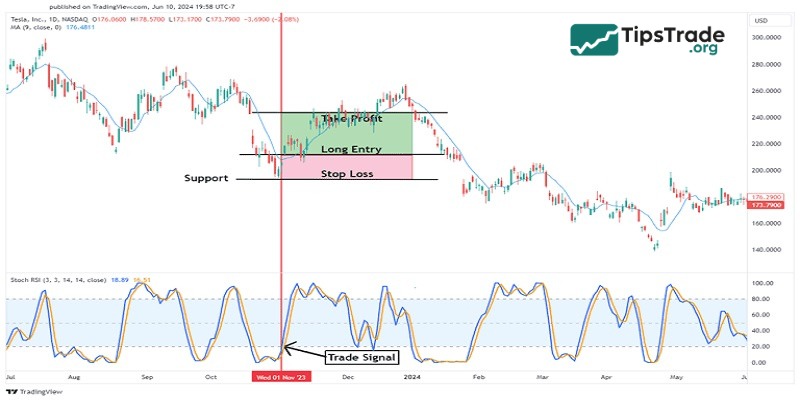
- Combining with support and resistance levels to decide entry points. For instance, when the price reaches a support zone and the Stoch RSI is below 0.2, a buy trade could be considered, and vice versa for sell trades.
Additionally, there are other conditions that can be combined with the Stochastic RSI to make trading decisions. These conditions vary depending on the trader, market, or financial instrument. Therefore, each trader should develop their own trading system and perform thorough, detailed backtesting before applying it in live trading.
Conclusion
Thanks to its speed and sensitivity to market fluctuations, the Stoch RSI can be considered a very useful indicator for traders in both short-term and long-term analysis. We hope that the insights shared by Tipstrade.org in this article have helped you better understand what the Stoch RSI indicator is. Wishing you successful trading!
See more: