

Forex trends Determination plays an important role in helping traders identify the main trend of the currency market to make informed trading decisions. Identifying Forex trends allows traders to filter out market noise, minimize unnecessary risks and capture potential profit opportunities. Identifying Forex trends involves using tools such as moving averages, trend lines and momentum indicators. Find out at tipstrade.org in this article to improve your trading strategy and success.
What is a Trend in Forex Trading?
A trend in forex trading is the consistent directional movement of a currency pair over a given period. Trends are classified into three main categories:
Uptrend (bullish market)
- Characterized by higher highs and higher lows.
- Indicates that buyers are dominant and demand is increasing.
- Example: EUR/USD rising steadily from 1.05 to 1.12 with clear upward momentum.
Downtrend (bearish market)
- Characterized by lower highs and lower lows.
- Indicates sellers are in control, pushing prices lower.
- Example: GBP/JPY falling from 160.00 to 148.00 as economic data weakens.
Sideways or range-bound trend
- Price moves between support and resistance without breaking out.
- Indicates indecision or balance between buyers and sellers.
- Example: USD/CHF trading between 0.90 and 0.92 for weeks without a breakout.
Visual charts are the most effective way to spot these structures. Platforms like TradingView or MetaTrader 4 (MT4) allow traders to plot candlestick charts that make patterns easy to see. Recognizing whether a pair is trending or ranging is the first step in any solid forex trend analysis.
>>See more:
- What is Forex? The Complete Guide for Beginners
- What are exchange rates? How to read and analyze rates in Forex
- Top 10 best forex currency pairs to trade in 2025
- Essential Forex Orders every trader must know
- What is forex trading? A detailed guide to forex trading from A – Z
Why is it important to identifying Forex trends?
Being able to determine forex trends is one of the most important skills a trader can master. It helps align your strategy with the market instead of working against it.
Benefits of Trading with the Trend

- Higher probability trades: Trends often persist due to market psychology, allowing traders to ride momentum.
- Risk reduction: Trading against the trend often results in sudden losses when momentum resumes.
- Simpler decision-making: Beginners can focus on entering in the direction of the trend rather than guessing tops and bottoms.
- Consistency: Identifying the trend creates a structured approach to trading.
Real-World Example
- When the U.S. Federal Reserve raises interest rates, the U.S. dollar often strengthens, leading to sustained uptrends in pairs like USD/JPY or USD/CHF.
- Traders who identify this early can position themselves with the broader market sentiment.
Key Takeaway
- Forex trend determination is not just about technical patterns.
- It is about understanding the balance between buyers and sellers and aligning your trades with the underlying flow.
Methods of Determining Forex Trends
There are several reliable methods to identify forex trends, each with strengths and limitations. Successful traders often combine multiple approaches to confirm signals.
Price Action Analysis
Price action is the study of raw market movement without relying heavily on indicators.
- Uptrend: Higher highs (HH) and higher lows (HL)
- Downtrend: Lower highs (LH) and lower lows (LL)
- Sideways: Price oscillates between support and resistance levels
Example:
If EUR/USD creates successive higher swing points, it signals a bullish trend. If it breaks below a key support and forms lower lows, a bearish trend emerges.
Advantages:
- Clean and easy to interpret
- Works on all time frames
- No lagging indicators
Limitations:
- Can be subjective for beginners
- Market noise may cause false readings
Moving Averages (MA)
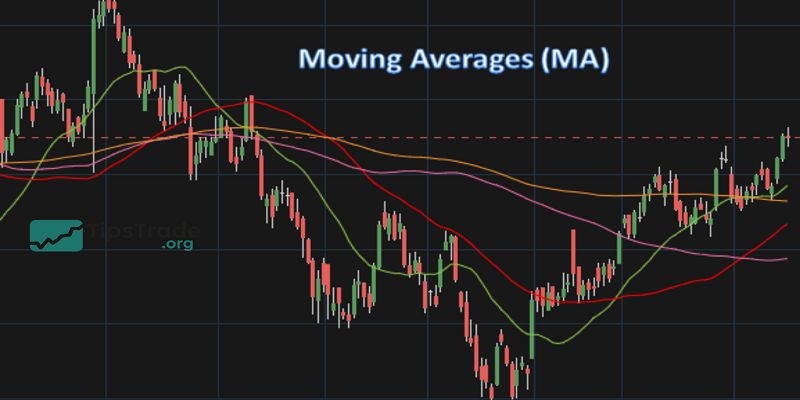
Moving averages smooth out price data to reveal the underlying trend.
- Simple Moving Average (SMA): Equal weight to all data points
- Exponential Moving Average (EMA): More weight to recent data, reacts faster
Key Techniques:
- Golden Cross: Short-term MA (e.g., 50-day) crosses above long-term MA (e.g., 200-day) → bullish signal
- Death Cross: Short-term MA crosses below long-term MA → bearish signal
- Dynamic Support/Resistance: Price bouncing off MA levels confirms trend direction
Practical Tip: Beginners often use the 50 EMA and 200 EMA on daily charts for clear signals.
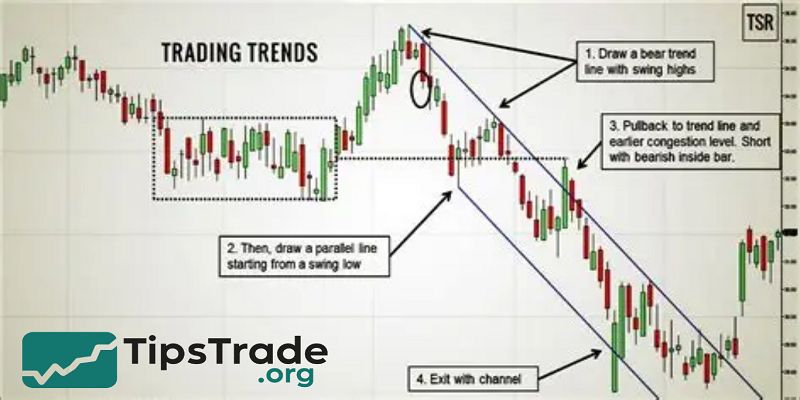
Trendlines and Channels
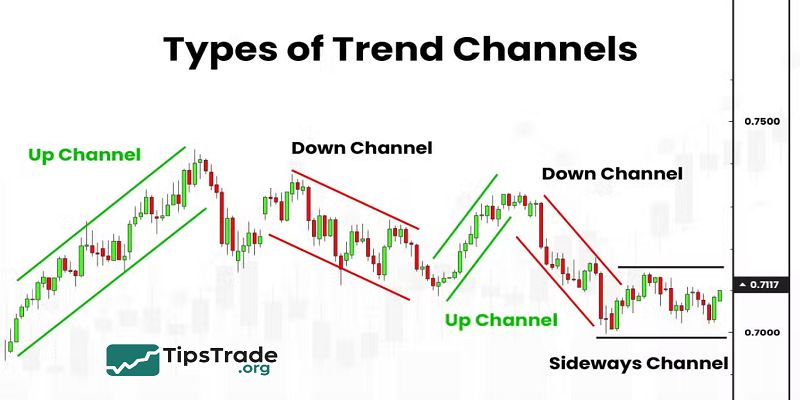
Drawing trendlines is one of the simplest ways to visualize trends.
- Uptrend line: Connect at least two rising lows
- Downtrend line: Connect at least two declining highs
- Price channel: Combine parallel trendlines to capture both support and resistance
Example:
If GBP/USD consistently respects an upward sloping line, traders can identify the dominant trend and potential entry zones.
Common Mistakes:
- Forcing a trendline to fit the chart
- Drawing with too few touchpoints
- Ignoring false breakouts
Technical Indicators
Several indicators are specifically designed for forex trend analysis.
- MACD (Moving Average Convergence Divergence): Identifies trend direction and momentum through crossovers and histogram shifts.
- RSI (Relative Strength Index): Primarily measures overbought/oversold, but also reveals divergence that signals trend reversals.
- ADX (Average Directional Index): Measures trend strength. Readings above 25 indicate a strong trend; below 20 suggest weak or sideways movement.
Comparison Table:
| Indicator | Best Use | Strength | Weakness |
| MACD | Trend reversals, momentum | Clear crossover signals | Slightly lagging |
| RSI | Divergence, overbought/oversold | Simple & effective | False signals in strong trends |
| ADX | Strength of trend | Works with other tools | Doesn’t show direction |
Multiple Time Frame Analysis

Multiple Time Frame Analysis (MTFA) involves analyzing charts across different time horizons to get a complete picture.
Top-down approach:
- Start with the weekly chart to see the dominant trend
- Move to the daily chart for medium-term direction
- Use H4 or H1 for precise entries
Example:
EUR/USD may be in an uptrend on the daily chart but showing retracement on the H1 chart. Combining both views prevents entering against the larger trend.
Benefits:
- Confirms reliability of signals
- Helps avoid confusion from short-term noise
- Aligns trading strategy with long-term momentum
Combining Trend Determination Methods
Relying on a single method can lead to false signals. Professional traders combine tools for confirmation.
Example Approach:
- Use price action to identify structure (higher highs/lows)
- Apply moving averages to confirm direction
- Add ADX to measure trend strength
Case Study:
On EUR/USD:
- Daily chart shows higher highs and higher lows (price action)
- 50 EMA above 200 EMA (moving averages)
- ADX above 25 confirms a strong trend
Common Mistakes When Determining Forex Trends
Even with the right tools, beginners often make avoidable errors.
- Overloading indicators: Using too many indicators creates conflicting signals.
- Confusing retracement with reversal: A pullback is temporary; a reversal changes the trend entirely.
Ignoring fundamentals: Economic news like interest rate changes can abruptly shift trends. - Short-term bias: Focusing only on lower time frames without checking the bigger picture.
- Incorrect trendlines: Drawing imprecise lines can mislead traders.
Tip: Always confirm signals with at least two different methods before placing a trade.
Practical Tips for Beginners

If you are new to forex, mastering trend determination starts with discipline and simplicity.
- Follow the main trend: Avoid counter-trend trades until you have more experience.
- Use higher time frames: Daily charts give a clearer picture than noisy 5-minute charts.
- Keep a trading journal: Record how you identified trends, the tools used, and the trade outcome.
- Risk management: Always set stop-loss levels to protect your account.
- Avoid FOMO: Wait for confirmation instead of chasing price.
Beginner-friendly strategy:
- Identify the trend on the daily chart
- Confirm with moving averages
- Enter on H4 with price action signals
- Protect position with stop-loss below recent swing
Real-World Examples of Forex Trend Determination
Example 1 – Uptrend on EUR/USD
- EUR/USD rises steadily from 1.05 to 1.12. Price forms higher highs, 50 EMA is above 200 EMA, and MACD histogram supports bullish momentum.
- Traders who entered pullbacks enjoyed strong upward continuation.
Example 2 – Downtrend on GBP/JPY
- GBP/JPY drops from 160.00 to 148.00. Lower lows appear, MACD crosses down, and ADX rises above 25, confirming a powerful bearish trend.
Example 3 – Sideways on USD/CHF
- USD/CHF consolidates between 0.90 and 0.92.
- Indicators show weak momentum, ADX below 20, confirming range-bound trading.
- In this scenario, traders focus on buying support and selling resistance instead of trend-following.
Advanced Trend Determination Strategies
For experienced traders, combining technical and fundamental analysis leads to deeper insights.
- Technical + Fundamental Analysis: Use indicators alongside economic data like GDP, CPI, or central bank interest rate decisions.
- Fibonacci Retracement: Distinguish between temporary pullbacks and actual reversals.
- Ichimoku Cloud: A complete system showing trend, support, resistance, and momentum.
- Trading Platforms: Tools like MT4, MT5, and TradingView provide advanced features for trend identification.
Pro Tip: Use economic calendars from trusted sources (Investing.com, ForexFactory) to anticipate news that could trigger new trends.
Word Count
Forex trend determination is essential for traders to identify the main market direction and make effective trading decisions. It involves analyzing price charts and technical indicators like moving averages and RSI to confirm the trend’s strength and direction. Accurate trend determination helps minimize risks, optimize profits, and adapt strategies to market changes. Overall, it is a fundamental skill for successful forex trading.