
In modern financial trading, especially in the derivatives market, CFD indicators play a crucial role in helping traders analyze the market and make more informed trading decisions. Due to the use of high leverage and fast price movements, CFD trading requires effective analytical tools to minimize risk and maximize potential profits.
This article explores Top 6 best CFD indicator tools every trader should know and practical strategies to help you dominate the market!
What is a CFD indicator?
A CFD indicator is a technical analysis tool used in CFD (Contract for Difference) trading to analyze price behavior, market trends, momentum, and volatility. These indicators are calculated based on historical data such as opening price, closing price, trading volume, and time.
See more:
- What is CFD? Contracts for Difference Explained for Beginners
- CFD Forex: Why Do Investors Choose CFDs Instead of Direct Trading?
- Compare CFDs and Stocks: Differences, Similarities, and Which to Choose?
Advantages of using CFD indicator tools
CFD indicators help traders add structure to market analysis by turning price movement into measurable data. This reduces guesswork and supports more consistent decisions. They are especially useful when integrated into a clear trading plan. Instead of reacting emotionally, traders rely on objective reference points.
Key advantages of using CFD indicators include:
- Trend identification to determine market direction and bias
- Momentum confirmation to assess the strength of price moves
- Volatility awareness to adapt position size and stop placement
- Timing support for entries and exits
- Risk management guidance through clearer market structure

Best CFD indicator tools every trader should know
There are dozens of CFD indicators that can be displayed on the charts. Below is an outline of the best CFD indicator tools that one should know of.
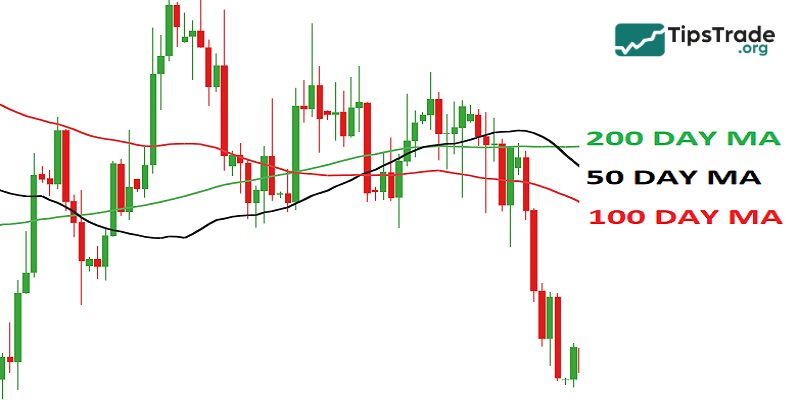
Moving Averages (MA)
Moving Averages help smooth price data, allowing traders to identify trend direction more clearly. For day trading, short-term moving averages such as the EMA 9 (9-period Exponential Moving Average) and EMA 21 are particularly effective.
– How to use:
- Trend identification: When price consistently stays above the moving average, it signals an uptrend. Conversely, when price consistently remains below the moving average, it suggests a downtrend.
- Crossovers: Combine two moving averages with different periods (for example, EMA 9 and EMA 21) to identify crossover points.
- Bullish crossover: Occurs when the short-term EMA crosses above the long-term EMA.
- Bearish crossover: Occurs when the short-term EMA crosses below the long-term EMA.
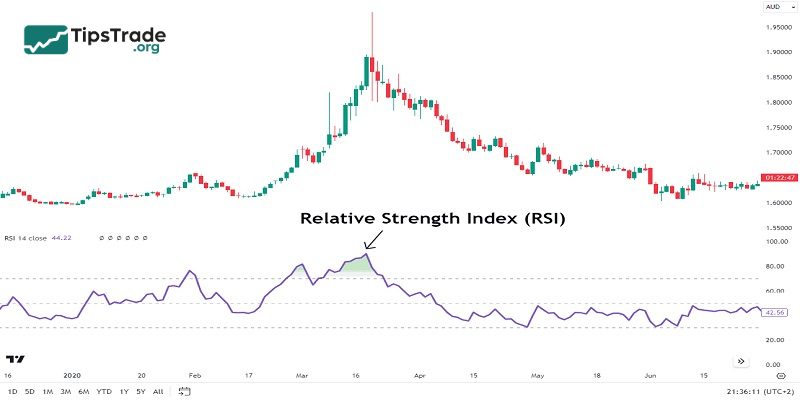
Relative Strength Index (RSI)
RSI (Relative Strength Index) is one of the most effective CFD indicator tools for measuring the strength and speed of price movements, allowing CFD traders to identify overbought and oversold conditions. Use the 14-period RSI with threshold levels set at 70 (overbought) and 30 (oversold).
– How to use:
- Look for divergence signals, where the RSI indicator and price action move in opposite directions, indicating a potential trend reversal.
- In strong trends, RSI may remain in overbought or oversold territory for an extended period. Therefore, RSI should be used in combination with other trend indicators to confirm signals more accurately.
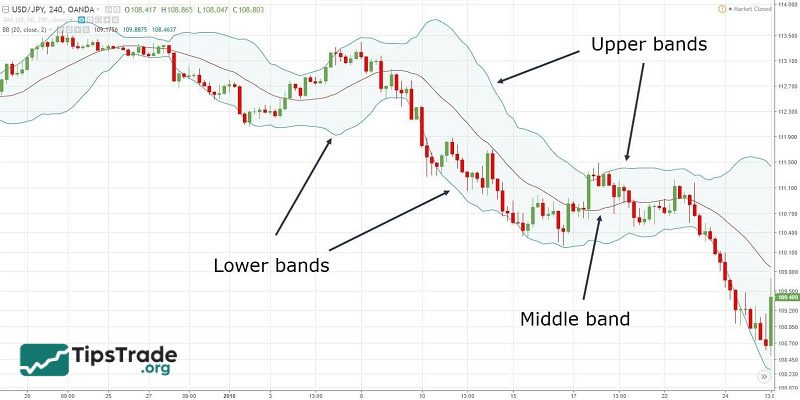
Bollinger Bands
The structure of Bollinger Bands consists of a Simple Moving Average (SMA) and two standard deviation bands plotted above and below the SMA. This CFD indicator type measures market volatility and identifies potential breakout opportunities.
– How to use:
- Narrow bands (Squeeze): When the bands contract and become narrow, it indicates low volatility and often signals an upcoming period of strong price movement. A breakout above or below the bands can open up potential trading opportunities.
- Wide bands: When the bands expand, it indicates high volatility. Traders can use this to identify overstretched price conditions (overbought/oversold) and look for mean reversion trading setups.
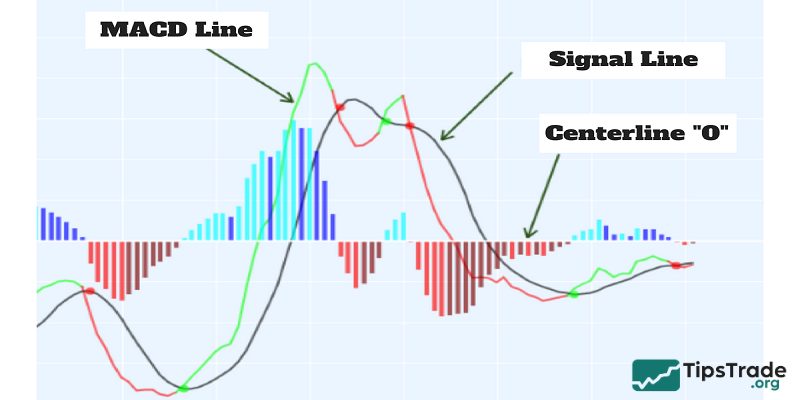
Moving Average Convergence Divergence (MACD)
MACD is a trend-following and momentum CFD indicator that represents the relationship between two moving averages of a security or asset’s price.
– Components:
- MACD Line: Difference between the 12-period EMA and 26-period EMA.
- Signal Line: 9-period EMA of the MACD line.
- Histogram: Visual representation of the difference between the MACD line and the Signal line.
– How to use:
- Look for crossovers between the MACD line and the Signal line. A bullish crossover occurs when the MACD line rises above the Signal line, while a bearish crossover occurs when it falls below.
- Divergence between the MACD and price action can indicate potential reversals.
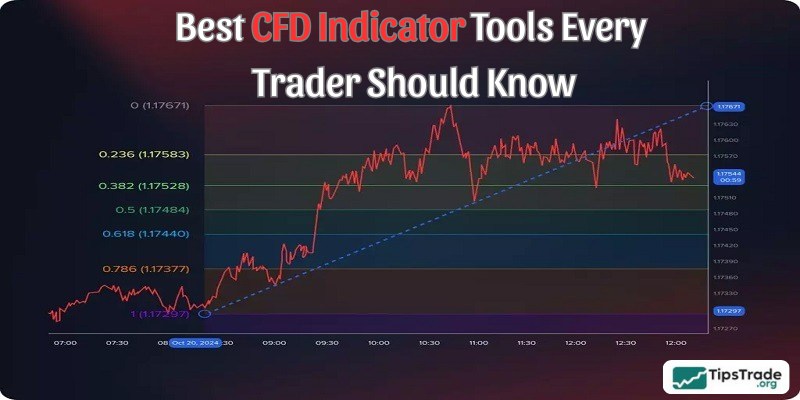
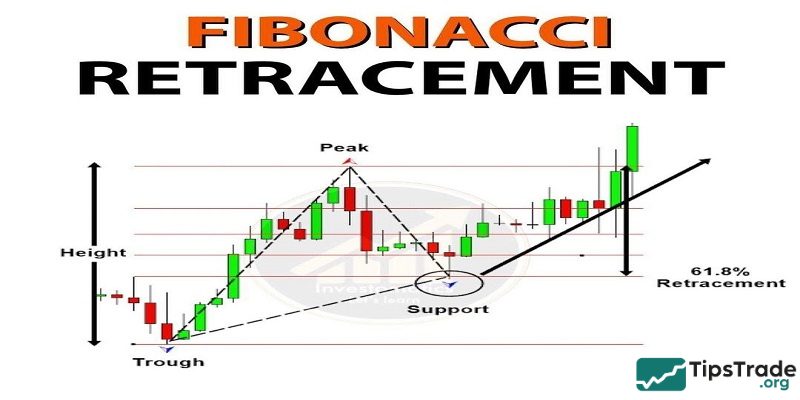
Fibonacci Retracement
Fibonacci Retracement levels are horizontal lines used to identify potential support and resistance zones based on key Fibonacci ratios: 23.6%, 38.2%, 50%, 61.8%, and 78.6%.
– How to use:
- Identify the drawing range: Look for a significant price move (from a swing high to a swing low, or from a swing low to a swing high) and apply the Fibonacci Retracement tool.
- Trade planning: Use these retracement levels to plan entry points, set stop-loss orders, and define profit targets.
- Example: In an uptrend, if price pulls back to the 38.2% or 50% retracement level, it may signal a potential buying opportunity.
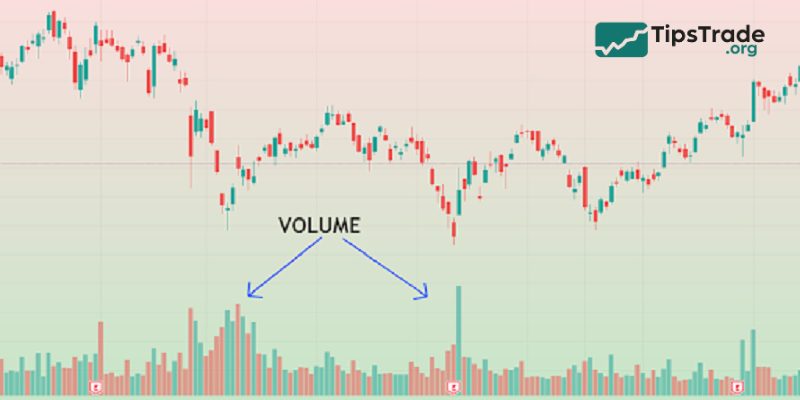
Volume indicators
Finally, the last tools in this list of the best CFD indicators are volume indicators. Accordingly, they help confirm the strength of price movements by analyzing the level of trading activity in the market.
– Examples:
- On-Balance Volume (OBV): Tracks cumulative buying and selling pressure by adding volume on up days and subtracting volume on down days.
- Volume Weighted Average Price (VWAP): Calculates the average price a security has traded at throughout the day, weighted by volume. It is particularly useful for intraday traders to identify fair value.
– How to use:
- Use OBV to confirm trends. Rising OBV alongside rising prices indicates strong buying interest, while falling OBV with falling prices signals strong selling pressure.
- VWAP can be used as a dynamic support or resistance level, especially for intraday trading.
Common mistakes when using CFD indicator tools
CFD indicator tools are often misunderstood and misused, especially by beginners. These mistakes reduce effectiveness and increase confusion instead of clarity.
- Indicator overload – Using too many CFD indicator tools creates conflicting signals and analysis paralysis. Simpler setups improve focus and execution.
- Blind signal following – Taking trades based only on CFD indicator signals without price context leads to late or low quality entries.
- Ignoring market structure – CFD indicator tools behave differently in trends and ranges. Without identifying structure, signals lose reliability.
- Using default settings blindly – Default parameters may not suit all markets or timeframes. Settings should align with trading style and volatility.
- Replacing risk management with indicators – CFD indicator tools do not control risk. Stop losses, position sizing, and exposure limits remain essential.
Conclusion
And above is the list of “Top 6 Best CFD Indicator Tools Every Trader Should Know” that we would like to introduce to you. We hope that this article has provided you with valuable trading insights. Wishing all CFD traders successful and profitable trading!