

TradingView crypto indicators are essential tools for crypto traders who want to analyze the market accurately and improve their trading success rate. With powerful technical indicators, TradingView helps traders identify trends, determine entry points, and manage risk more effectively. In this article, we will explore the top TradingView crypto indicators that every trader should use to optimize their trading strategy!
Introduction to TradingView crypto indicators
TradingView crypto indicators are technical analysis tools built into the TradingView platform that help traders analyze cryptocurrency price movements using historical and real-time data. These indicators use mathematical formulas to measure market trends, momentum, volatility, and trading volume in the crypto market.
On TradingView, crypto indicators can be divided into several categories, including trend indicators, momentum indicators, volatility indicators, and volume indicators. Each type of indicator plays an important role in helping traders identify entry points, exit points, and manage trading risks more effectively.
Thanks to their visual representation on charts, TradingView crypto indicators allow traders to easily recognize market patterns and make data-driven trading decisions instead of relying on emotions.

>>See more:
- How to Use TradingView Mobile App for Beginners 2026
- How to Sign Up TradingView Account? Step-by-Step Guide
- How to draw trendline TradingView to analyze market trends in 5 minutes!
- TradingView Stocks: A Guide to Analysis and Identifying Precise Entry Points
Benefits when traders use TradingView crypto indicators
When it comes to TradingView crypto indicators, people usually mention the following three main uses:
- Identifying trends: Use trend indicators to determine the current price trend. It is recommended to combine multiple indicators to increase the reliability of the results.
- Identifying buy/sell points: Use oscillators to identify potential trend reversal zones, thereby determining potential entry and exit points.
- Risk management: Use indicators to identify support and resistance levels of stocks or other profitable assets, helping you plan ahead for different market scenarios.
Types of TradingView crypto indicators
TradingView crypto indicators transform raw data such as price and trading volume into specific signals, helping you optimize your trades more effectively. Accordingly, TradingView crypto indicators are divided into four main categories to help investors track different market movements, including:
- Price indicators
- Trend indicators
- Momentum indicators
- Volume indicators
|
Types of TradingView crypto indicators |
Common indicators |
Best use case |
|
Price Indicators |
Support/Resistance levels, Price patterns |
All timeframes |
|
Trend Indicators |
Moving Averages (MA), Trendlines |
Long-term trading |
|
Momentum Indicators |
Relative Strength Index (RSI), Moving Average Convergence Divergence (MACD) |
Short-term trading |
|
Volume Indicators |
Volume chart, On-Balance Volume (OBV) |
Identifying price movement |
Each category provides different insights to help traders understand market behavior. For example, volume indicators show whether large investors or institutions are influencing stock prices, while momentum indicators reflect whether the price trend is rising or falling.
In practice, professional traders often combine multiple indicators and technical chart analysis to identify price patterns, trends, or buy/sell signals.
Top TradingView crypto indicators for traders
Below are common TradingView crypto indicators, which many traders apply to assess the market.
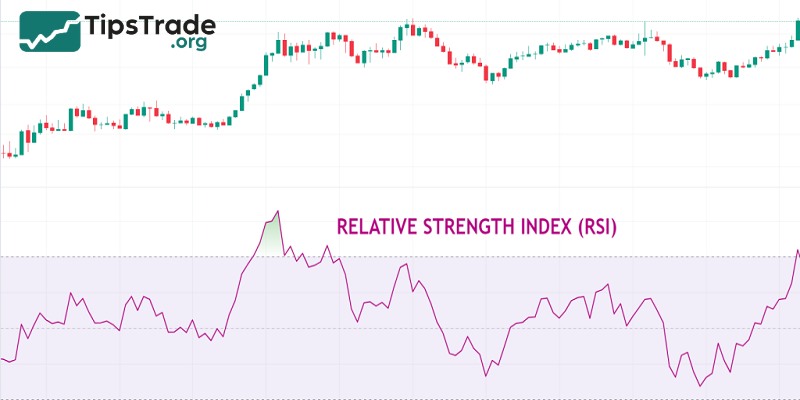
RSI – Identify overbought/oversold zones
RSI provides the magnitude of price increases or decreases. In other words, you can use RSI to assess price momentum and determine whether an asset is overbought (above 70) or oversold (below 30).
RSI is commonly used in trending markets to identify OB/OS levels based on price momentum. Traders benefit from this indicator most of the time because it is useful for determining entry timing, trend direction, and support and resistance levels.
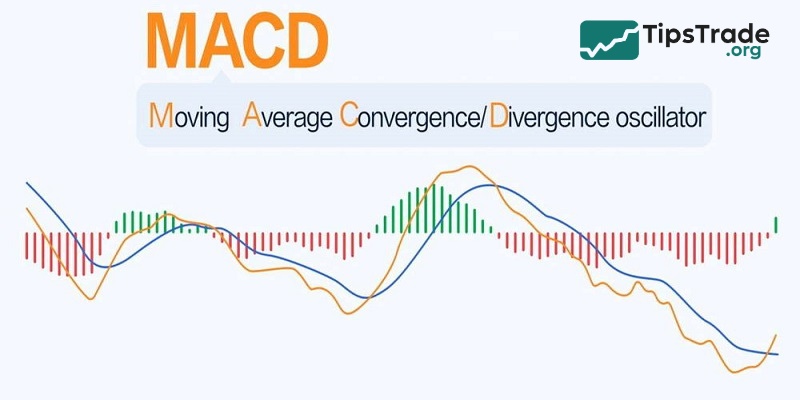
MACD – Detect trends and entry signals
MACD stands for Moving Average Convergence Divergence. With this indicator, you can compare two moving averages. The relationship between these two elements helps you understand why price movements are becoming stronger or weaker.
It is important to note that convergence occurs when the two moving averages start moving closer together and momentum decreases. On the other hand, divergence is the opposite, meaning momentum increases as the moving averages move further apart.
Typically, MACD can be used in combination with RSI. It is also considered one of the best technical indicators for scalping trading.
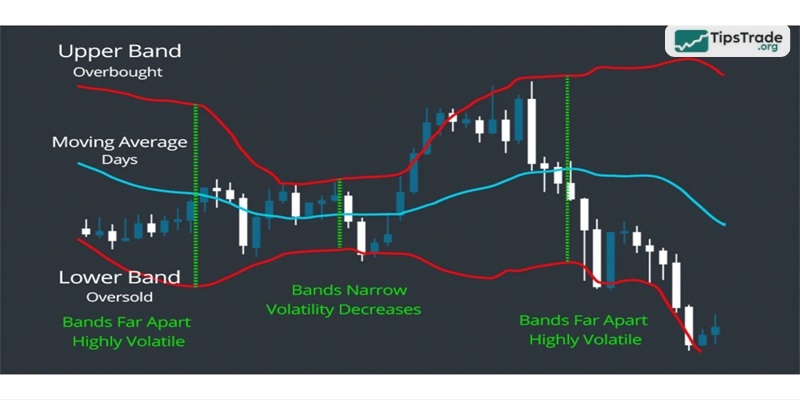
Bollinger bands – Predict price volatility
Bollinger Bands are one of the best TradingView crypto indicators. However, what you may not know is that Bollinger Bands do not tell you the direction of a breakout. Instead, they are used to identify market volatility and heavily traded areas, thereby signaling that a breakout may be about to occur.
With this indicator, you use historical price data to determine the highest and lowest points of an asset. Based on the distance between the bands, they indicate volatility. When the bands move farther apart, it means volatility has increased. When the bands move closer together, it indicates that the market is less volatile.
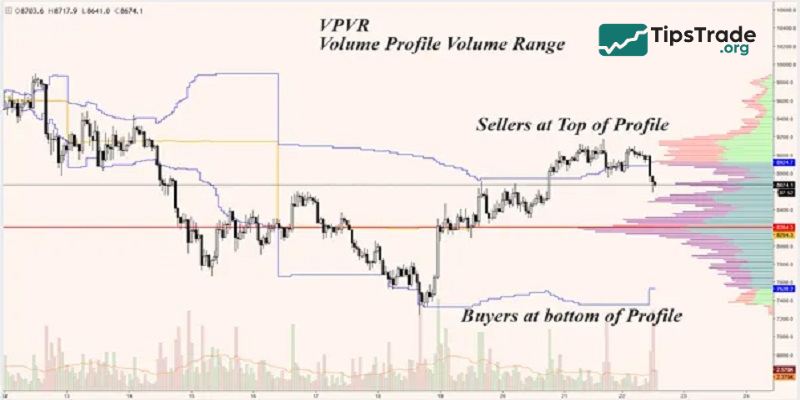
Volume profile visible range (VPVR) – Analyze market liquidity
In crypto, volume is king. VPVR displays volume by price level (horizontal bars) instead of time, helping you identify the “value areas” where whales are active.
- POC (Point of control): The longest red line, representing the price level with the highest trading volume (a price magnet).
- Volume gaps: Areas where price moves very quickly (pump/dump zones).
- Benefits: It helps you identify where to place pending buy orders (Limit Orders) to trade in line with the big money flow.
How to add TradingView crypto indicators to a chart
You can display the saved indicator on a chart using:
- Functions “Add to chart”;
- Import panels.
Adding via “Add to Chart”
The fastest way to see only the saved custom indicator on the chart is to click the “Add to chart” button on the top panel of the editor or press the Ctrl+Enter key combination.
After this, the new technical analysis tool is ready for use.
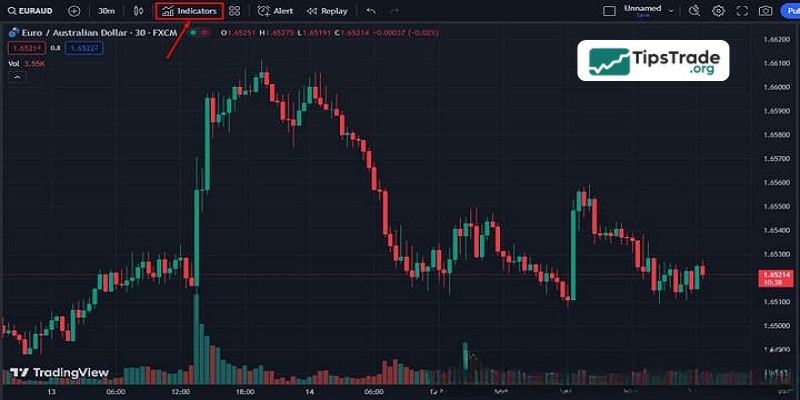
Adding via the Import Panel
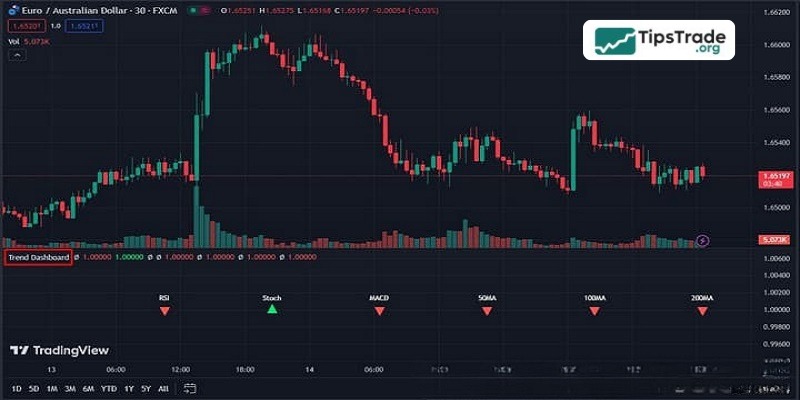
A more common way to select analytical tools is to display them on a chart using the “Indicators, Metrics & Strategies” panel, which can be accessed by clicking the “Indicators” button in the main window.
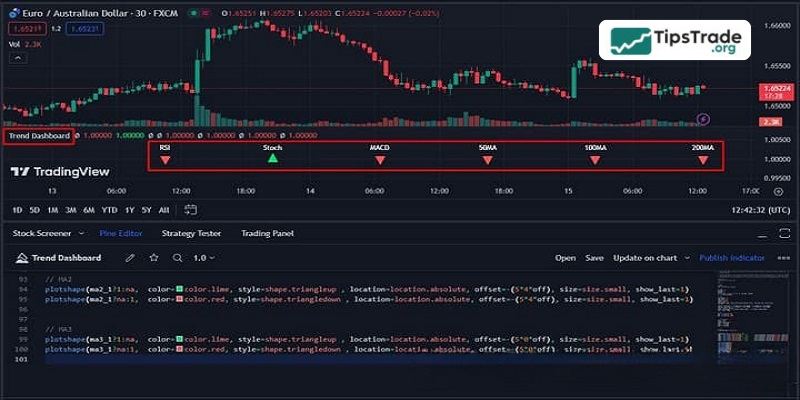
In the panel itself, go to the “My Scripts” section and find the previously saved indicator there – Trend Dashboard.
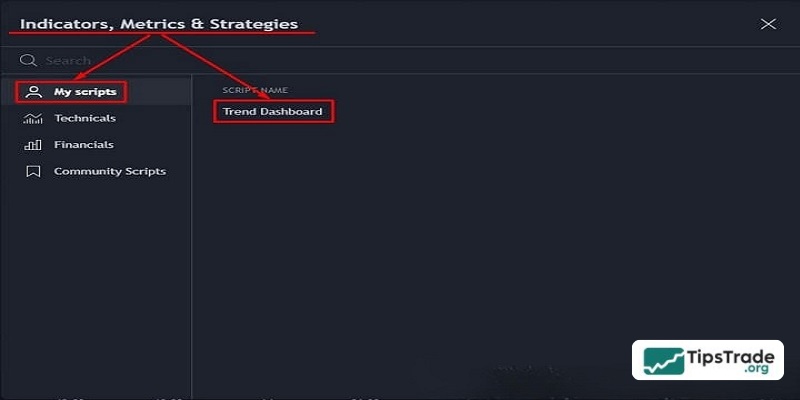
Double-clicking on the name will display our indicator on the chart.
Notes when trading with TradingView crypto indicators
TradingView crypto indicators can help traders increase the probability of success when entering trades. However, these tools are not a “holy grail.” Below are some important notes to keep in mind when using TradingView crypto indicators to trade more effectively:
- When using any tool, the most important thing is to identify the trend. If a trader cannot determine the trend and only relies on Buy/Sell signals from indicators, the risk of losses will be very high.
- There are hundreds of indicators available. Traders need to clearly understand the nature of each indicator before choosing which ones to use. To understand an indicator’s nature, traders should carefully examine the formula behind it.
- Signal conflicts between indicators are also an issue traders need to understand. Each indicator is built on different formulas, so depending on the timeframe and trading strategy, traders should choose a suitable group of indicators to use.
Above, Tipstrade.org has introduced some important TradingView crypto indicators that all traders should understand well and apply to the analysis of financial assets to improve the accuracy of decision-making and generate profits.