
What is forex technical analysis? Perhaps you have heard this phrase when exploring the financial market, especially Forex. This is not just a technical term, but also a powerful tool that helps traders predict price trends and make trading decisions. In this article, Tipstrade.org will help you understand more about technical analysis, from the basic principles to the tools and practical applications of it in Forex trading.
What is forex technical analysis?
Forex technical analysis is the process of analyzing and studying data related to past prices and trading to predict future trends. Technical analysis focuses on charts and formulas, which can help investors identify buying and selling opportunities by assessing the long-term trends of the market. You can use technical analysis across various time frames from minutes (M1, M5, M15, M30…) to hours (H1, H2, H3, H4…) and to daily, monthly, and yearly time frames.
Forex technical analysis is the school of market analysis that is most widely used by traders today, especially in the Forex market. It is not that technical analysis is more suitable for Forex, but rather that technical analysis is recognized as more effective compared to other markets. This is because Forex is a vast market that is very difficult to manipulate prices.

>>See more:
- What is Forex? The Complete Guide for Beginners
- What are exchange rates? How to read and analyze rates in Forex
- Top 10 best forex currency pairs to trade in 2025
- Essential Forex Orders every trader must know
- What is forex trading? A detailed guide to forex trading from A – Z
Key principles of forex technical analysis
Forex technical analysis has 3 fundamental principles as follows:
Price discounts everything
This principle means that all factors affecting price fluctuations in the market, such as information about the economy, politics, or society, whether very important or less important, have already been reflected in the price. By simply looking at price movements, traders can determine whether supply or demand is currently dominant. Thus, traders do not need to look at individual data points but only need to look at the price to analyze the market according to technical analysis.
Prices move in trends
The fluctuations in prices in the market will follow one of three directions: Up, Down, or Sideways. If we deny this principle, meaning that we believe prices move without a trend, or in other words, fluctuate chaotically, then traders using technical analysis will not be able to predict the market’s direction by looking at the prices.
History tends to repeat itself
As mentioned, the most important raw material for Forex technical analysis is price. Price is where all past investor actions are reflected. Those actions stem from the trader’s levels of psychological greed or fear. Prices record these psychological levels and reflect them in chart patterns. In each investment phase, the emotions of Greed and Fear dominate traders in the present, thereby creating price patterns similar to those that have appeared in the past. By looking at these patterns, traders can somewhat predict the next direction of the price. If market history doesn’t repeat itself, traders can’t use past price data to predict future price movements.

Popular forex technical analysis tools
Forex technical analysis uses charts and various analytical tools. The combination of analytical tools can create convergence points that improve the probability of predicting future price trends.
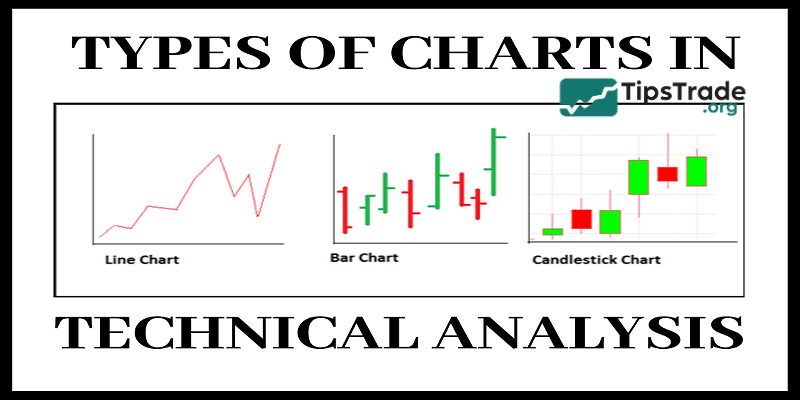
Price chart
Charts are the “heart” of Forex technical analysis. In Forex, there are 3 common types of charts:
- Line Chart: Only shows the closing price over time, simple and suitable for viewing overall trends.
- Candlestick Chart: Displays the opening, closing, highest, and lowest prices within a certain time period. This type of chart is the most commonly used in Forex due to its detail and ease of analysis.
- Bar Chart: Similar to candlesticks but less popular in the Forex community.
Traders can customize the timeframes on the charts (1 minute – M1, 1 hour – H1, 1 day – D1, etc.) to match their own trading style.
Technical indicators
Indicators are mathematical tools integrated into trading platforms such as MetaTrader 4 (MT4) or MetaTrader 5 (MT5), helping traders analyze prices more easily:
- Moving Averages (MA): Includes SMA (Simple Moving Average) and EMA (Exponential Moving Average). MA helps smooth price data to identify trends. For example, when the 50 EMA crosses above the 200 EMA, it is a buy signal (uptrend).
- RSI (Relative Strength Index): An oscillating index ranging from 0 to 100, measuring the strength of a trend. An RSI above 70 indicates that the market may be “overbought,” while below 30 indicates “oversold.”
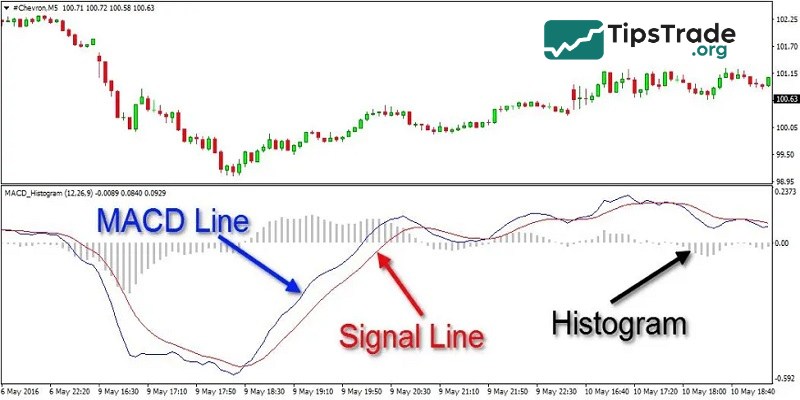
- MACD (Moving Average Convergence Divergence): It consists of two lines, the MACD line and the Signal Line. When the MACD line crosses above the Signal Line, it is a sign that an upward trend is beginning.
- Bollinger Bands: Consist of three lines (the middle line is the MA, the upper/lower lines are the standard deviations). When the price touches the upper band, the market may reverse downwards; touching the lower band may indicate a rebound.
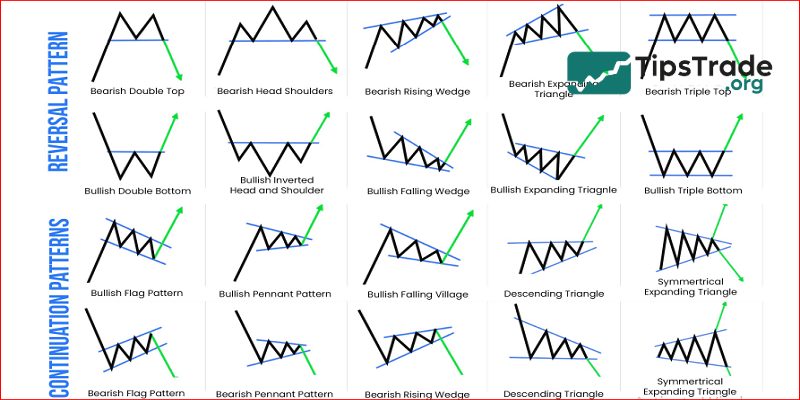
Price patterns
Price patterns are characteristic shapes on charts that help predict the next direction of price.
Bullish patterns:
- Inverse head and shoulders: Consists of three troughs (left shoulder, head, right shoulder), with the “head” being the lowest point. When the price breaks above the neckline, it signals the beginning of an upward trend.
- Bull flag: Appears after a strong upward movement (flagpole), followed by a consolidation phase (flag). When the price breaks above the flag, the upward trend continues.
Bearish patterns:
- Double top: Price touches the peak twice at the same level (M shape), then drops sharply when breaking the support (neckline).
- Descending triangle: Price creates lower highs and flat lows. A breakout below the low signals a strong downtrend.
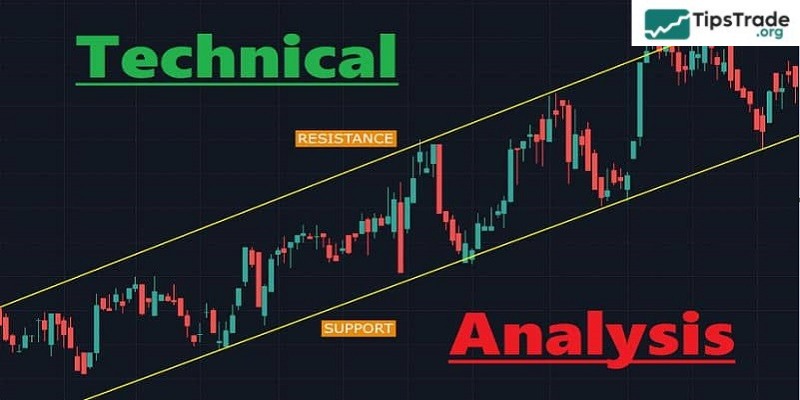
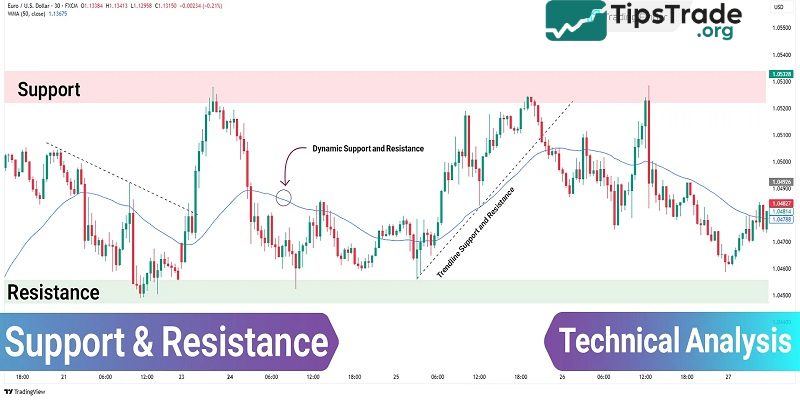
Support and resistance levels
- Support: This is the price level where buying pressure is strong enough to prevent further price declines. This is often where traders place buy orders or set stop-loss orders when selling. For example, on the H4 chart of XAU/USD (gold), the support level of 1800 USD has been held firm through three tests, indicating strong demand. Traders can buy when the price returns to 1805 with a stop-loss at 1795.
- Resistance: It is the price level where selling pressure dominates, preventing the price from rising higher. This is where traders place sell orders or take-profit when buying. For example, on the D1 chart of USD/JPY, the resistance level at 110.00 caused the price to bounce down three times. Traders sell at 109.90 with a target of 109.00.
When support is broken, it can become new resistance and vice versa. Traders often draw horizontal lines on the chart to identify support/resistance levels, combining them with indicators or price patterns to increase the accuracy of trading signals.
The importance of forex technical analysis in trading
Determine market trends
Forex technical analysis helps traders identify price trends, including uptrends, downtrends, and sideways trends. Tools such as Moving Averages, Trendlines, or the ADX (Average Directional Index) indicator are often used to determine the market’s direction. Understanding the trend helps traders trade in the direction of the market, increasing their potential for profit.
Find entry and exit points
Forex technical analysis provides specific signals to determine when to buy or sell. For example:
- Price patterns: Patterns like Head and Shoulders, Triangles, or Flags help predict trend reversals or continuations.
- Support and resistance levels: These are price zones where the price tends to bounce back or break through, helping traders place buy orders at support and sell orders at resistance.
- Technical indicators: RSI, MACD, or Stochastic Oscillator help identify overbought or oversold conditions, thereby finding optimal entry points.
Risk management
Forex technical analysis not only helps find trading opportunities but also supports effective risk management. By using stop-loss levels based on support/resistance or the ATR (Average True Range) indicator to measure price volatility, traders can limit losses and protect their capital. The risk/reward ratio is also often calculated based on key price levels from technical analysis.
Predict Short-Term Price Fluctuations
The forex market is constantly fluctuating, especially in short timeframes. Forex technical analysis is very useful for scalpers or day traders. Tools like Japanese Candlesticks provide quick signals about potential price reversals or continuations.
Integration with trading strategies
Technical analysis can be integrated into a wide range of trading strategies, from news trading to algorithmic trading. For example, a trader might use Bollinger Bands to identify price volatility after an economic news release, thereby capitalizing on a price breakout.
Market psychology analysis
The price and volume data in technical analysis reflect the behavior of market participants. By observing price patterns or indicators like OBV (On-Balance Volume), traders can understand the crowd’s psychology, whether the market is dominated by fear or greed, and make appropriate decisions.
Benefits and drawback of forex technical analysis
Benefits of forex technical analysis
- Easy to access and apply: Forex technical analysis does not require deep knowledge of macroeconomics or finance like fundamental analysis. Anyone can learn how to read charts, identify price patterns, and use basic technical indicators. Tools such as moving averages, RSI, or MACD are readily available on popular trading platforms like MetaTrader and TradingView.
- Suitable for all time frames: Forex technical analysis can be applied to both short-term and long-term trading. Traders can customize their strategies based on the time frame they choose, from a few minutes to several months.
- Focus on price data: This method relies entirely on historical price and volume data, which is believed to reflect all market information (according to the hypothesis of Dow Theory). This helps traders not to analyze too many external factors.
- Automation capability: Strategies based on technical analysis can be easily programmed into trading robots or algorithms, aligning with the current trend of automated trading.
Drawbacks of forex technical analysis
- It is impossible to predict the impact of unexpected news: Forex technical analysis mainly relies on past data and cannot accurately predict market reactions to major events such as interest rate decisions, employment reports, natural disasters, or wars. These factors often cause strong fluctuations, disrupting technical patterns.
- Signal deviation ability: Technical indicators such as RSI or MACD can generate false signals, especially in low volatility or sideways markets. This can easily lead to inaccurate trading decisions.
- Effectiveness decreases in a sideways market: When the market does not have a clear trend (sideways), many technical tools such as moving averages or price patterns become less effective, increasing the risk of losses.
- Dependent on historical data: Technical analysis assumes that past patterns will repeat, but this is not always true. The market is always changing due to the influence of technology, policy, or investor sentiment.
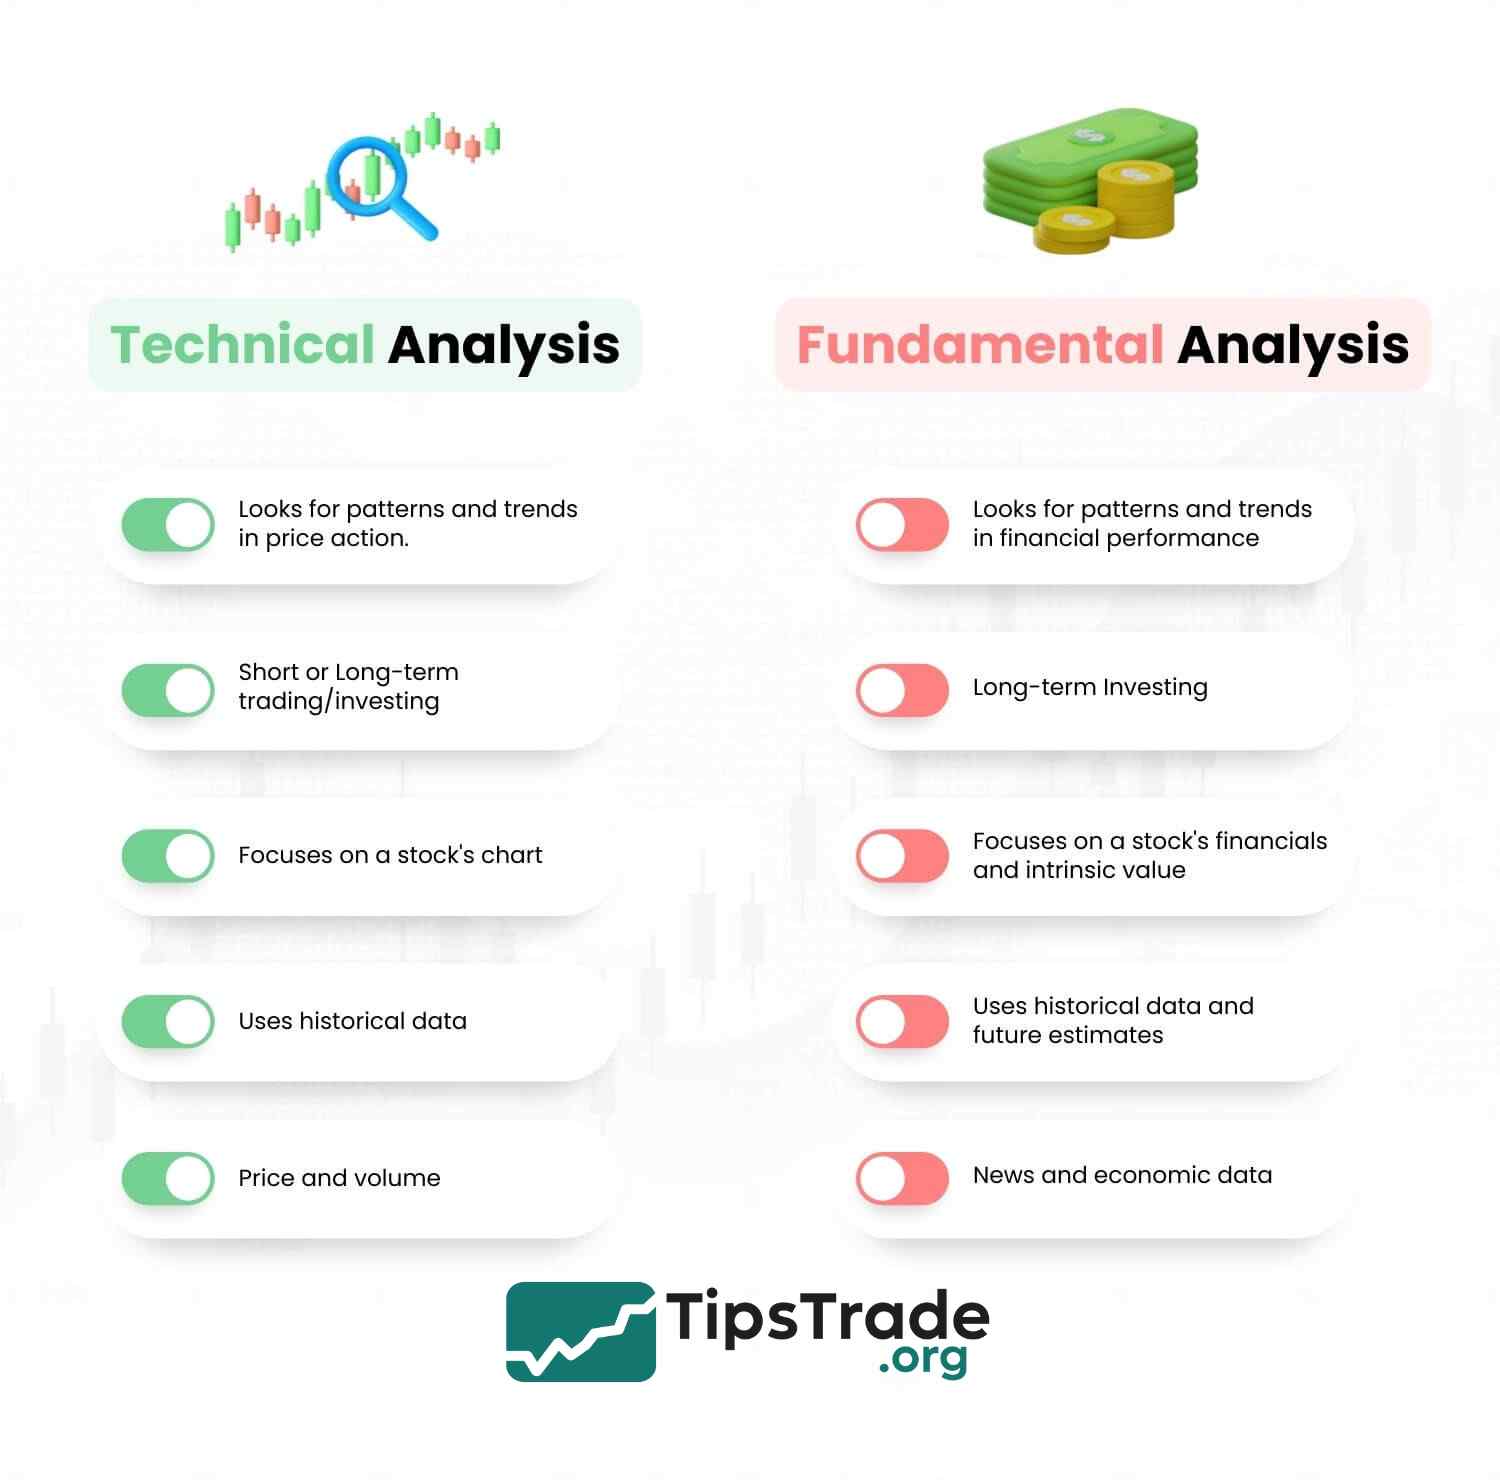
Forex technical analysis vs fundamental analysis
In addition to forex technical analysis, fundamental analysis is also a popular method used to study and forecast future price trends. However, unlike technical analysis, it always aims to measure the intrinsic value of a financial asset.
You can refer to the analysis table below to understand the differences between these two commonly seen market analysis methods, thereby choosing a method that suits you.
Conclusion
Through this article, we hope you have gained an overview of what Forex technical analysis is. Although it has certain limitations, Forex technical analysis remains an indispensable tool in every trader’s toolkit. Flexibly combining various technical analysis tools and methods, along with strict risk management, will help you improve your chances of success in the highly volatile financial market. Wishing you success!