
Understanding candlestick patterns correctly not only helps assess the strength of buyers and sellers, but also serves as a key to identifying trend reversals or continuation phases. Below are Top common basic candlestick patterns in technical analysis that you shouldn’t miss.
What are candlestick patterns?
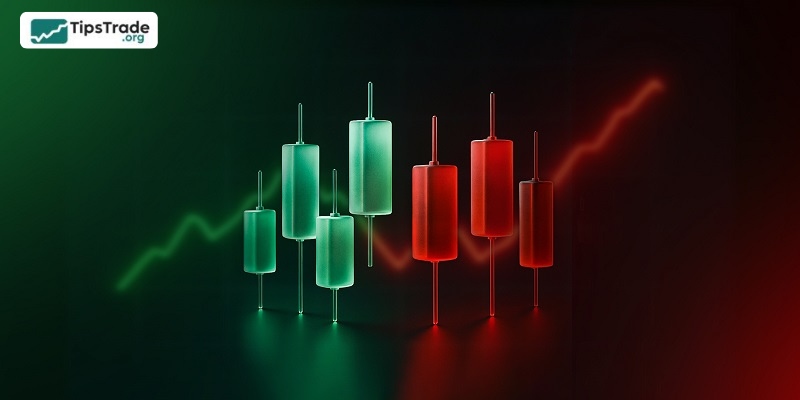
Candlestick patterns are formations created by one or more candlesticks on a price chart, reflecting price movements and market psychology over a specific period of time. Each candlestick pattern carries its own significance, helping traders anticipate potential future price trends.
See more:
- Top 4 most Continuation Candlestick Patterns in trading
- Best bearish reversal candlestick patterns not to be missed
- Top 8 powerful bullish reversal candlestick patterns you need to know
Components of candlestick patterns
It can be said that one of the simplest ways for traders to determine the price volatility of an asset over a certain period is to apply candlestick patterns. Each candle tells you four important pieces of information:
- Opening price (when trading began)
- Closing price (when trading ended)
- Highest and lowest price during that period
- The candle body tells you whether the price increased or decreased, while the candle shadow tells you the range of the price movement.
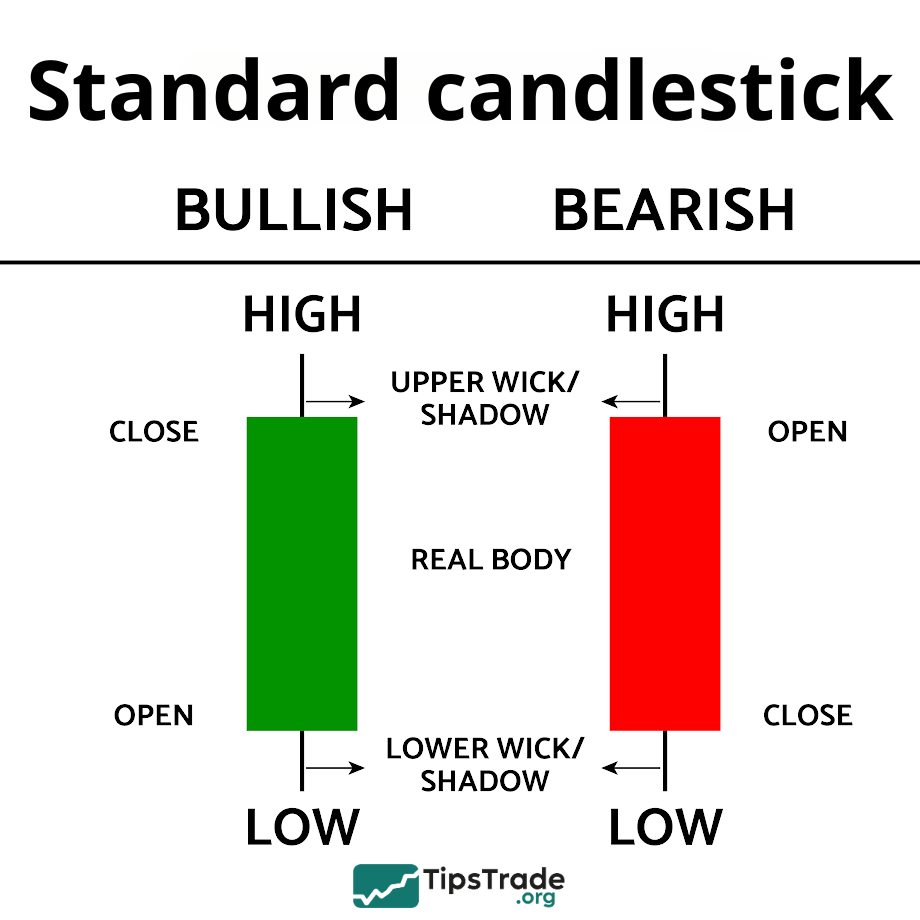
Imagine a burning candle. The body of the candle represents the time period during which the asset’s price moves from the starting point to the ending point. The upper wick shows the highest price the asset reached during that period, while the lower wick indicates the lowest price. The color of the candle’s body indicates whether the price has increased or decreased during this time. If the body of the candle is green or white, it means the closing price is higher than the opening price, and vice versa.
Top common basic candlestick patterns in technical analysis
Below are some of the most basic and commonly used candlestick patterns:
Standard candlestick
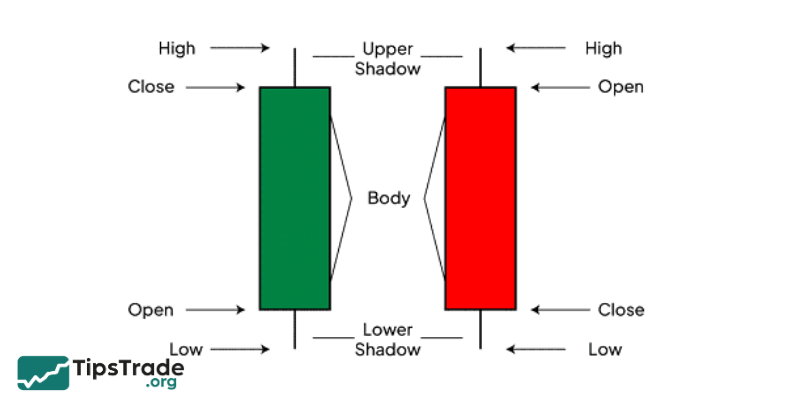
A standard candlestick is a common type of candle on a price chart that represents information about the opening price, closing price, highest price, and lowest price within a specific period of time.
A standard candlestick consists of two main components:
- Candlestick body: The body shows the price movement between the opening and closing prices. A bullish candlestick typically has a green body, while a bearish candlestick has a red body.
- Wicks (shadows): The wicks represent the highest and lowest prices during the candlestick’s time period. Long wicks indicate strong price volatility, whereas short wicks suggest weaker price movement.
Marubozu candlestick
The Marubozu candlestick is a special type of candlestick on a price chart, formed when the opening price is equal to the lowest price (bullish Marubozu) or equal to the highest price (bearish Marubozu). A Marubozu candlestick has a long body and no wicks, indicating strong dominance of a single market trend.
Marubozu candlesticks have characteristics that differ from standard candlesticks:
- Long body: A Marubozu has a long body, showing strong price movement during the candlestick’s time period.
- No wicks: A Marubozu has no wicks, reflecting complete control by buyers (bullish Marubozu) or sellers (bearish Marubozu).
Meaning of the Marubozu candlestick:
- Bullish Marubozu: A bullish Marubozu indicates that buyers are overwhelmingly strong, pushing the price to the highest level during the candlestick period. This is a sign of a strong uptrend.
- Bearish Marubozu: A bearish Marubozu indicates that sellers are overwhelmingly strong, pushing the price to the lowest level during the candlestick period. This is a sign of a strong downtrend.
Spinning Top candlestick
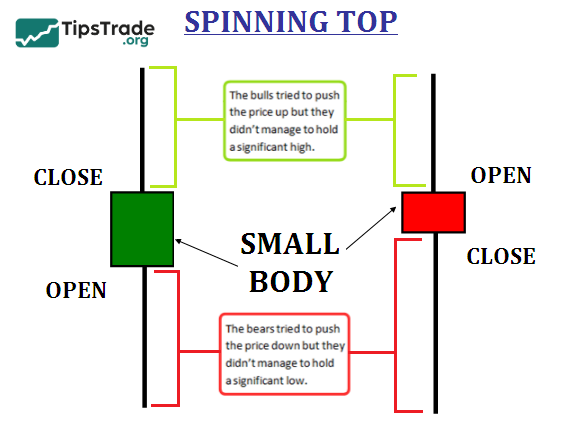
The Spinning Top candlestick is a neutral candlestick pattern (a doji-like candle with a real body) that commonly appears on price charts, representing indecision and a balance between buying and selling pressure over a specific period of time.
Characteristics of the Spinning Top candlestick:
- Short body: The Spinning Top has a short real body, indicating that the difference between the opening and closing prices is relatively small.
- Long wicks: It has relatively long and nearly equal upper and lower wicks. Long wicks show that both buyers and sellers attempted to push prices higher and lower during the session, but neither side gained control.
Meaning of the Spinning Top candlestick:
- Indecision: The Spinning Top signals market indecision and uncertainty. Buying and selling forces are fairly balanced, resulting in a closing price close to the opening price.
- No clear trend: The Spinning Top does not provide a clear signal about the upcoming price trend. It often appears during consolidation phases or as a pause after a strong uptrend or downtrend.
Hammer candlestick
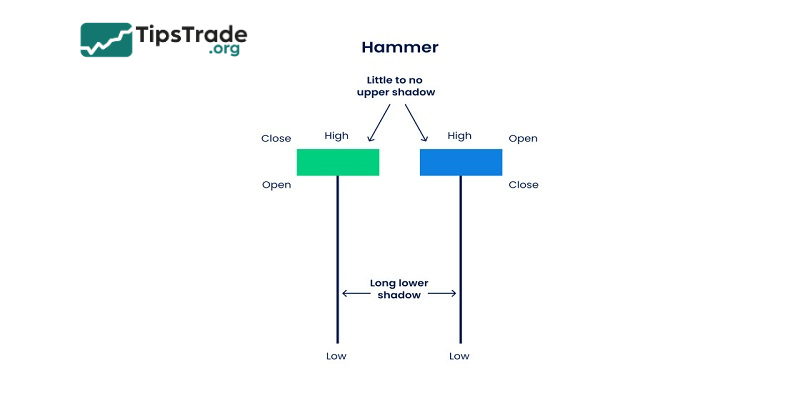
The Hammer candlestick is a strong bullish reversal pattern that typically appears at the end of a downtrend.
Characteristics:
- Short body: The Hammer candlestick has a short real body, indicating that the difference between the opening and closing prices is relatively small.
- Long lower wick: The Hammer has a long lower wick, at least twice the length of the body. This long lower wick shows that sellers pushed prices sharply lower during the session, but buyers strongly pushed prices back up to near the opening level.
- Short or no upper wick: The Hammer has a short or no upper wick, indicating weak or nonexistent selling pressure.
Meaning:
- Bullish reversal: The Hammer is a signal that a downtrend may be coming to an end and a bullish reversal could occur.
- Balance of forces: The long lower wick reflects a strong counterattack by buyers, while the short or absent upper wick indicates weak selling pressure.
- Market psychology: The Hammer represents hesitation from sellers and strong determination from buyers to push prices higher.
Inverted Hammer candlestick
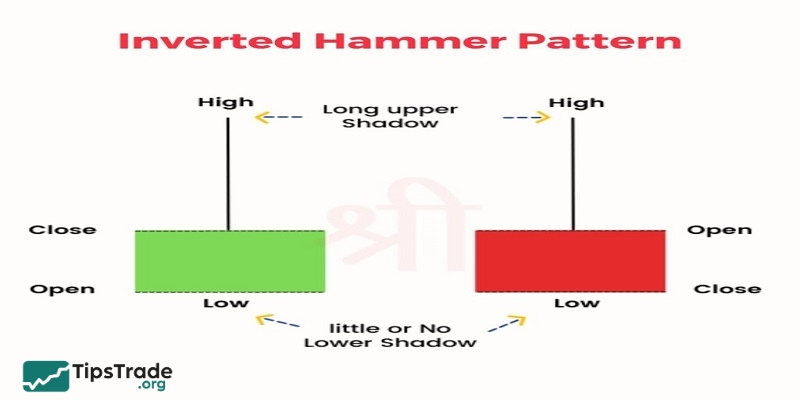
The Inverted Hammer is a bullish reversal candlestick pattern that typically appears at the end of a downtrend.
Characteristics:
- Short body: The Inverted Hammer has a short real body, indicating that the difference between the opening and closing prices is relatively small.
- Long upper wick: It has a long upper wick, at least twice the length of the body. The long upper wick shows that buyers pushed prices higher during the session, but sellers strongly countered and drove prices back down close to the opening level.
- Short or no lower wick: The Inverted Hammer has a short or no lower wick, indicating weak or nonexistent buying pressure.
Meaning:
- Bullish reversal: The Inverted Hammer signals that a downtrend may be coming to an end and a bullish reversal could occur.
- Balance of forces: The long upper wick reflects strong counterpressure from sellers, while the short or absent lower wick indicates weak buying pressure.
- Market psychology: The Inverted Hammer reflects hesitation from buyers and strong determination from sellers to push prices lower.
Hanging Man candlestick
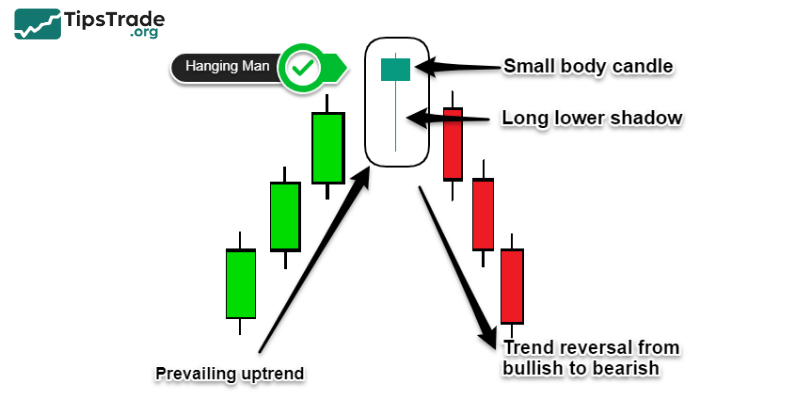
The Hanging Man candlestick is a potential bearish reversal pattern that typically appears at the top of an uptrend. This candlestick has distinctive characteristics and is commonly used by traders to anticipate a possible future price decline.
Characteristics of the Hanging Man candlestick:
- Short body: The Hanging Man has a short real body, indicating a small difference between the opening and closing prices.
- Long lower wick: The lower wick is usually at least 2–3 times the length of the body, showing strong selling pressure during the session.
- Short or no upper wick: This indicates weak or nonexistent buying pressure at higher price levels.
Meaning of the Hanging Man candlestick:
- Bearish reversal: The Hanging Man is a warning signal that an uptrend may be ending and a bearish reversal could occur.
- Weakness of buyers: The long lower wick shows that sellers were able to push prices down sharply, reflecting buyer weakness at higher price levels.
- Market psychology: The Hanging Man reflects buyer hesitation and increasing selling pressure, signaling a potential future price decline.
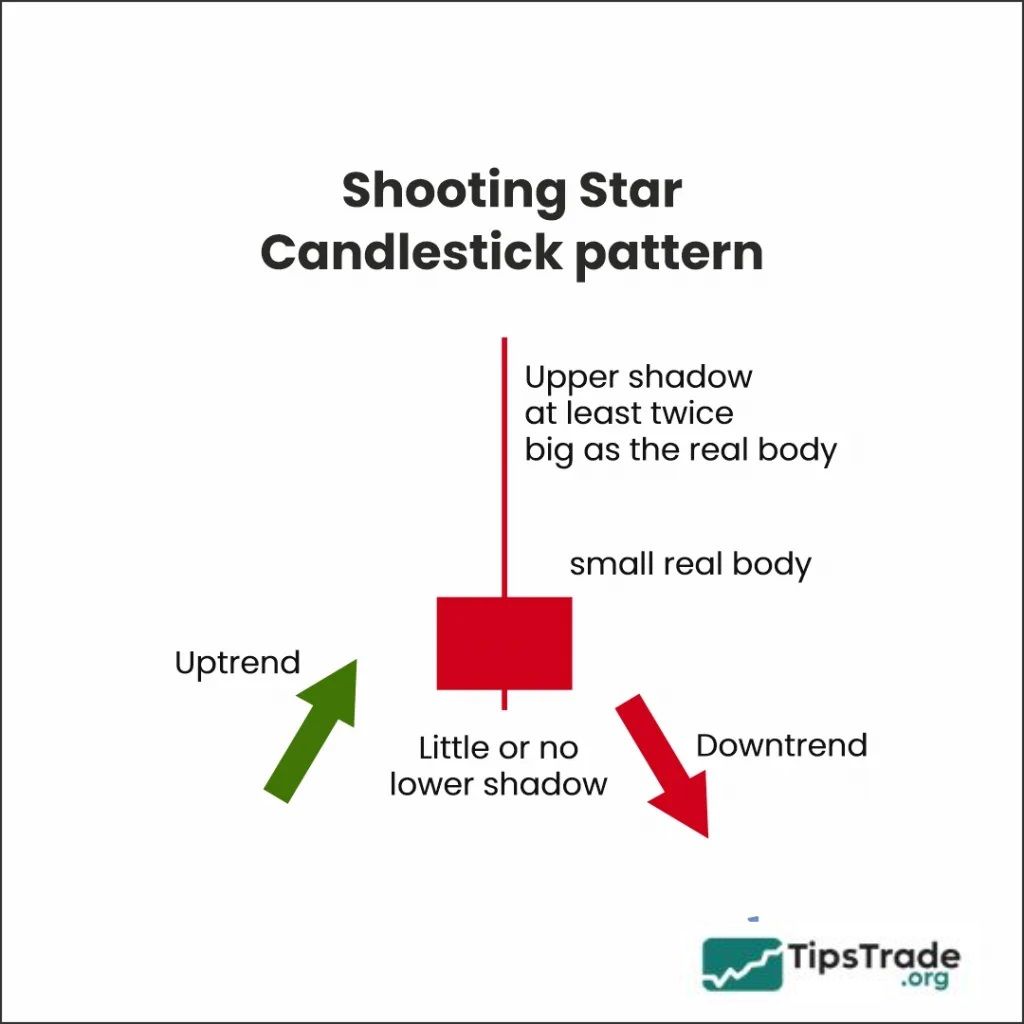
Shooting Star candlestick
The Shooting Star candlestick is a potential bearish reversal pattern that typically appears at the end of an uptrend. It has a distinctive shape resembling a shooting star, with a short real body and a long upper wick.
Characteristics of the Shooting Star candlestick:
- Short body: The Shooting Star has a short real body, indicating that the difference between the opening and closing prices is relatively small.
- Long upper wick: The upper wick is usually at least 2–3 times the length of the body. This long upper wick shows that prices were pushed sharply higher during the session but failed to sustain the upward momentum.
- Short or no lower wick: The Shooting Star has a short or nonexistent lower wick, indicating weak or absent buying pressure at higher price levels.
Meaning of the Shooting Star candlestick:
- Bearish reversal: The Shooting Star is a warning signal that an uptrend may be coming to an end and a bearish reversal could occur.
- Weakness of buyers: The long upper wick shows that prices were driven higher during the session but could not be maintained, reflecting weakness on the buying side.
- Market psychology: The Shooting Star reflects buyer hesitation at higher price levels and increasing selling pressure, signaling a potential future price decline.
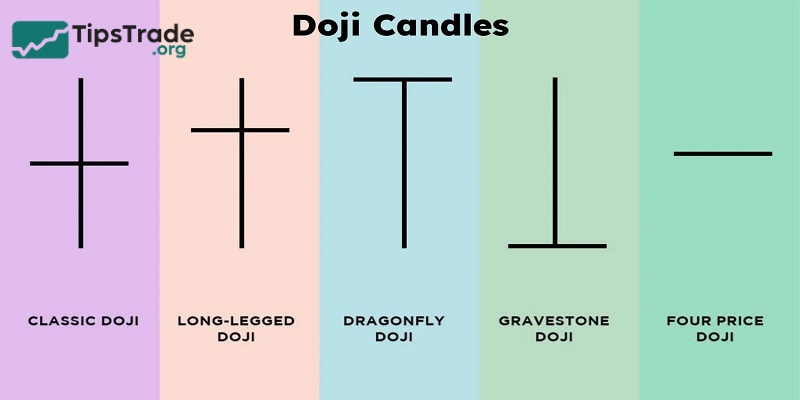
Doji candlestick
The Doji candlestick is a special type of candlestick on a price chart, formed when the opening price and closing price are nearly the same. A Doji has a very small real body, often appearing on the chart as a horizontal line, while its wicks can be long or short.
Types of Doji candlesticks:
- Doji Star: A single Doji with a small body and short wicks, representing a perfect balance between buying and selling pressure.
- Dragonfly Doji: This Doji has a small body and a long lower wick, indicating strong selling pressure during the session, but buyers managed to push the price back up close to the opening level.
- Gravestone Doji: This Doji has a small body and a long upper wick, indicating strong buying pressure during the session, but sellers pushed the price back down close to the opening level.
- Long-Legged Doji: This Doji has a small body with long upper and lower wicks, indicating strong price volatility during the session, while the closing price remains close to the opening price.
Characteristics of the Doji candlestick:
- Small body: The Doji has a very small real body, showing that the difference between the opening and closing prices is negligible.
- Wicks: Doji candlesticks may have long or short wicks, depending on the level of price volatility during the session.
Meaning of the Doji candlestick:
- Indecision: The Doji reflects indecision and balance between buyers and sellers during the trading session.
- Lack of a clear trend: The Doji does not provide a clear signal about the upcoming price trend. It may appear during market consolidation or as a pause after an uptrend or downtrend.
The success rate of candlestick patterns
This is an issue that many traders are concerned about. In reality, there is no specific number that can be applied to all cases. Accordingly, the effectiveness of candlestick patterns will depend on many factors. These can include market conditions, trading time frames, the type of asset being traded, and how you combine them with other analytical tools.
Candlestick patterns are like traffic lights on the road. They only help you make decisions, but they cannot always guarantee that those decisions will lead to a completely successful trade.
Advantages and disadvantages of candlestick patterns
Advantages of candlestick patterns
- The ability to visualize price data vividly, helping traders easily recognize patterns and trends.
- Candlestick patterns such as Doji, hammer, engulfing provide valuable signals about market sentiment and the possibility of reversal.
- Can be combined with other analysis tools to create effective trading strategies.
Disadvantages of candlestick patterns
- Identifying candlestick patterns is sometimes subjective, and in highly volatile markets, candlestick patterns can become difficult to distinguish.
- Candlestick patterns are not perfect prediction tools, and external factors can still affect prices.
- To effectively use candlestick patterns, traders need to combine them with other knowledge of technical analysis and practical trading experience.
Things need to do before trading with candlestick patterns
To become a successful trader, you need to:
- Combine candlestick patterns with other technical indicators, fundamental analysis and your own experience.
- Place a SL order to limit losses in case the market moves against your prediction.
- Trade regularly on a demo account to get familiar with candlestick patterns and practice your analytical skills.
- The market is always changing, so you need to update your knowledge and learn about new trading strategies.
Final thoughts
Although each candlestick pattern has its own characteristics and signals, the greatest value of candlestick patterns lies in their ability to help traders gain deeper insight into market behavior and capital flow psychology. To effectively utilize Top common basic candlestick patterns in technical analysis, traders need to practice regularly, test them across various market contexts, and combine them with technical indicators to increase the probability of success. Good luck!