
As an investor, you need to determine appropriate entry and exit points. Let’s explore Top 8 powerful bullish reversal candlestick patterns and forecast future price trends in the article below.
What is the bullish reversal candlestick?
The bullish reversal candlestick is a specific chart formation that signals a potential shift in market sentiment from a downtrend to an uptrend. These patterns suggest that selling pressure is exhausting and buyers (the “bulls”) are beginning to take control of the price action.
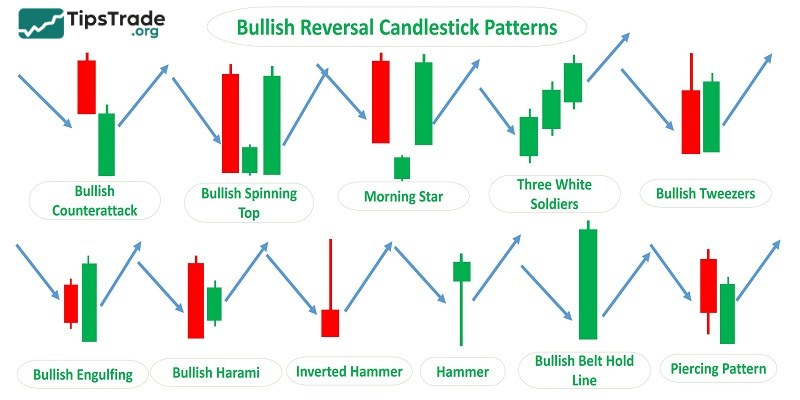
Top 8 powerful bullish reversal candlestick patterns
Below are Top 8 powerful bullish reversal candlestick patterns that investors must know:
Dragonfly Doji Candlestick
Dragonfly Doji candlestick is the most common candlestick pattern of the bullish reversal candlestick. It has a distinctive shape, resembling a dragonfly spreading its wings. A Dragonfly Doji typically forms at the end of a downtrend, featuring a very small or nonexistent real body, a long lower shadow, and a short or nonexistent upper shadow.
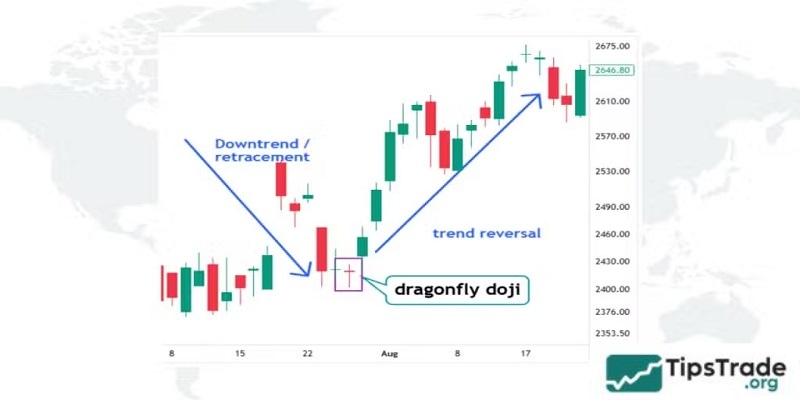
The Dragonfly Doji pattern indicates that during the early part of the session, sellers dominated and pushed prices down to extremely low levels. However, once the price reached its lowest point, strong buying pressure emerged. Buyers then gained control, driving the price back up and closing near the reopening level.
At this point, the closing price is also the highest price of the session, which is why the real body is pushed to the top rather than sitting in the middle. When a Dragonfly Doji appears, it suggests that buyers have taken full control in subsequent sessions and the market is likely to experience a strong bullish reversal.
Bullish Engulfing Candlestick
The Bullish Engulfing candlestick pattern consists of two candles: the first is a bearish candle, while the second is a bullish candle that completely engulfs the body of the first one.
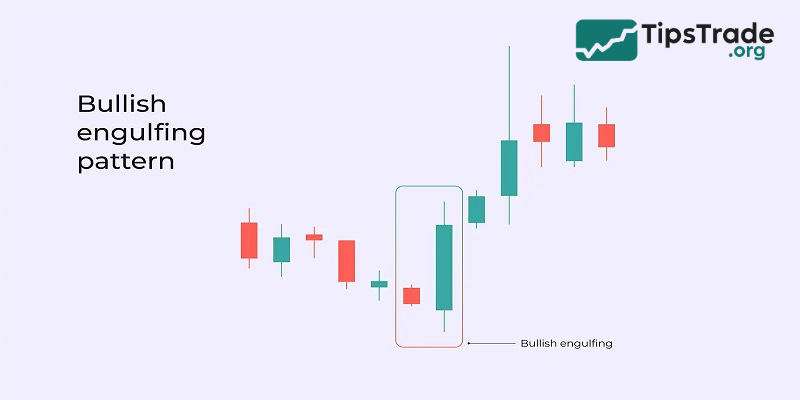
With this pattern, after a strong downward move, the appearance of a large bullish candle that “swallows” the previous candle makes a trend reversal highly likely. The reversal signal becomes even stronger if the first candle is a Doji.
The first candle indicates that sellers are in control, pushing the closing price below the opening price. However, strong buying pressure then emerges, driving the price to close above the first candle. The appearance of a Bullish Engulfing pattern signals that buyers have regained dominance in the market.
Piercing Pattern
The Piercing Pattern formation also consists of two candles, in which the first is a bearish candle and the second is a bullish candle. The length of the bullish candle must be at least half the length of the preceding bearish candle. In addition, the opening price of the bullish candle must form a certain gap below the closing price of the bearish candle.
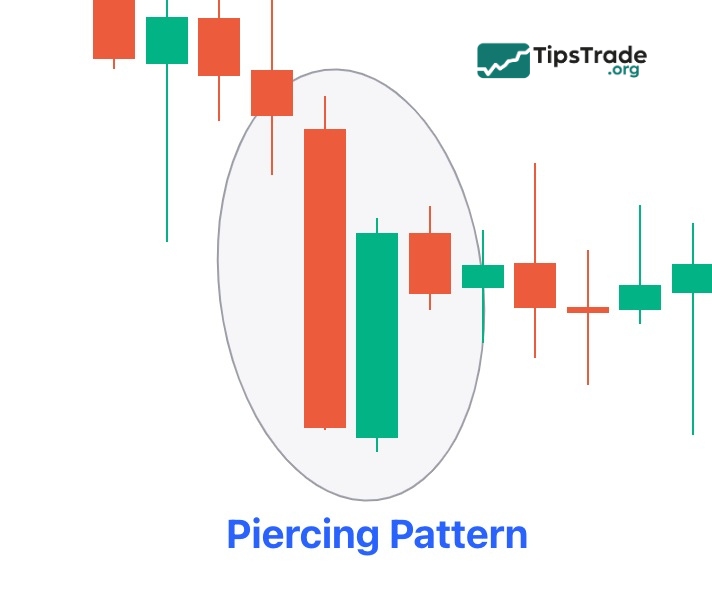
The appearance of a strong bullish candle immediately after a sharp decline signals that buyers are attempting to overpower sellers. If the Piercing Pattern is followed by another bullish candle, the likelihood of a trend reversal becomes even more evident.
Hammer Candlestick
When it comes to powerful bullish reversal candlestick patterns, the Hammer candlestick cannot be overlooked. The Hammer has a shape similar to a Doji, characterized by a small real body, a long lower shadow, and a short or almost nonexistent upper shadow.
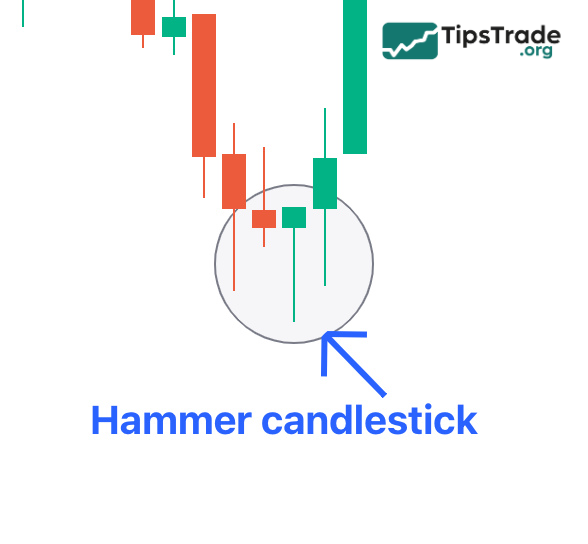
This candlestick appears after a downtrend and indicates that buyers are gradually taking control. When sellers attempt to push prices lower, buyers step in and drive prices back up.
The Hammer pattern is most effective when the preceding downtrend consists of three consecutive bearish candles and the Hammer is followed by a bullish candle.
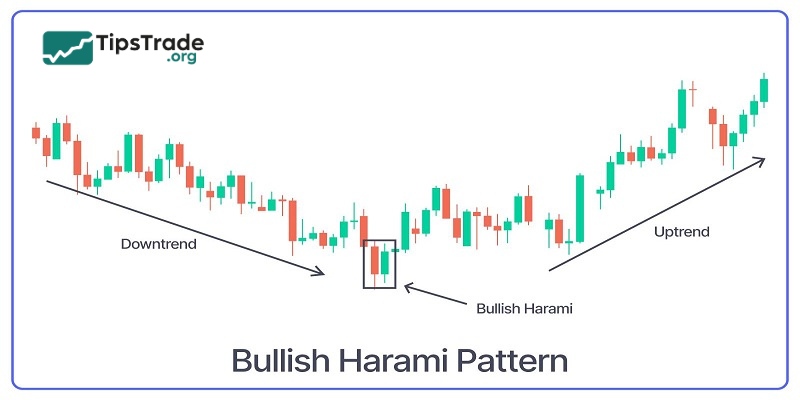
Bullish Harami Candlestick
This pattern consists of two candles: the first is a relatively large bearish (red) candle, and the second is a bullish (green) candle that is completely engulfed by the previous one.
When the market is in a strong downtrend, the appearance of a bullish candle indicates that prices are no longer willing to move significantly lower and that buyers are gradually regaining strength. However, it is necessary to observe an additional candle after the Bullish Harami candlestick completes to confirm whether a true trend reversal is taking place.
Morning Star Candlestick
The Morning Star candlestick is a three-candle pattern. The first candle shows a strong bearish move, the second has little to no real body and resembles a Doji, Hammer, or Spinning Top, and the third is a bullish candle.
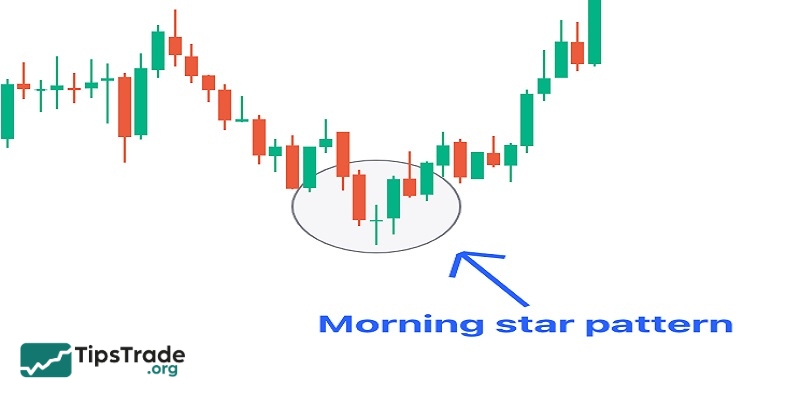
The first candle indicates that sellers are in control and push prices down to very low levels. As prices continue to decline, buyers begin to hesitate, leading to the formation of the second candle. Buyers then regain control and drive the closing price higher, which is why the third candle appears. This signals a trend reversal, and traders may begin to enter positions.
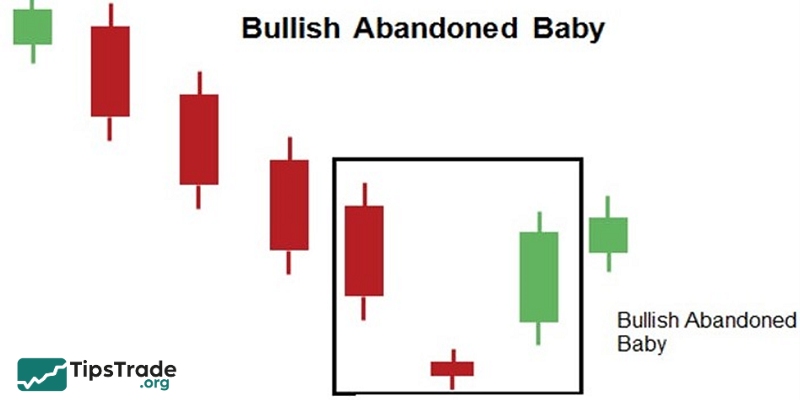
Bullish Abandoned Baby Candlestick
This candlestick pattern is formed by three candles. The first and third candles are relatively large, while the middle candle is smaller and is clearly separated from the other two, which is why the pattern is called “Abandoned Baby”.
The first candle represents a strong downtrend in the market. When price volatility narrows to the point where the closing price is nearly equal to the opening price, the second candle forms. Continued downward movement creates a significant gap, allowing the third candle to appear and triggering a strong bullish trend on a larger scale.
Tweezer Bottom Candlestick
The Tweezer Bottom candlestick is a two-candle pattern in which the first candle is a long bearish candle, and the second is a bullish candle whose opening price is equal to the previous day’s closing price.
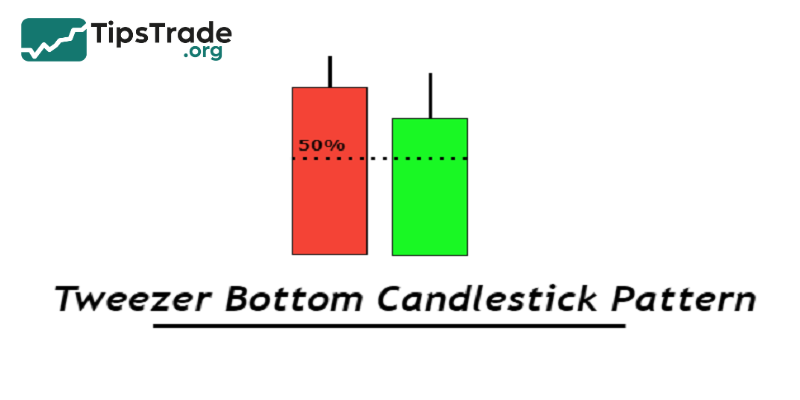
The first candle indicates that prices are moving downward, while the second candle signals a market recovery. This allows investors to gauge the price difference and determine the most appropriate timing to enter a trade.
Principles for trading with bullish reversal candlestick patterns
Powerful bullish reversal candlestick patterns signal market trends and help investors make accurate and timely assessments. However, to trade successfully, several key principles should be kept in mind:
Only enter a trade after the bullish reversal candlestick is fully formed
You should wait for the final signal candle of the bullish reversal candlestick to close in order to accurately confirm the candlestick formation before making a trading decision. Entering a trade too early can easily lead to incorrect judgments and increased risk. Therefore, patience is essential to improve your chances of success.
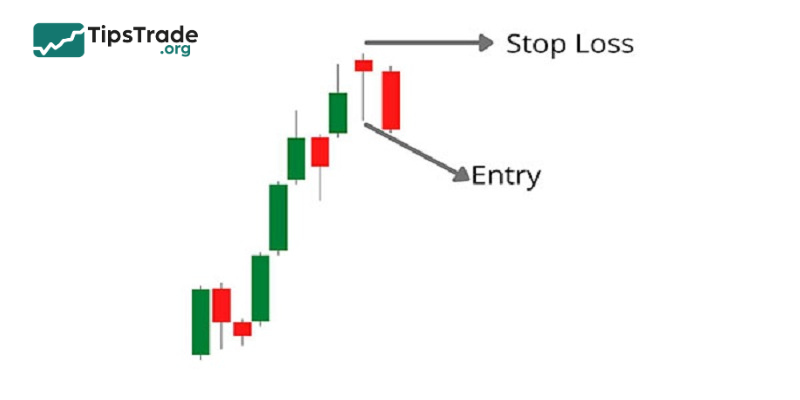
Never forget to set a stop loss
There is no situation that is 100% safe, so you should always set a stop-loss order to protect yourself against unfavorable outcomes. With bullish reversal candlestick patterns, the stop loss should be placed above or below the extreme of the pattern. Ideally, the stop-loss level should be set about 2–3 pips beyond the candle’s wick to avoid being stopped out by minor price retracements.
Take Profit
In bullish reversal candlestick patterns, the minimum price target used for taking profit should be equal to the size of the pattern itself. This means you can apply a risk-to-reward (R:R) ratio such as 1:1 or 1:2 when setting your take-profit level.
Keep in mind that this target represents the minimum expected profit. Since bullish reversal candlestick patterns often perform better than anticipated, you may also use a trailing stop when taking profit to maximize potential gains.
Steps to trade using bullish reversal candlestick patterns
Based on powerful bullish reversal candlestick patterns, investors can predict price trends and identify suitable entry points. So how can these bullish reversal candlestick patterns be applied effectively? Investors may refer to the following four steps for trading with bullish reversal candlestick patterns.
Step 1: Analyze and identify the market trend
The first step is to observe, analyze, and determine the current market trend. Investors need to assess whether the trend is upward or downward, and whether it is strengthening or weakening.
To identify the market trend, investors can use technical chart analysis, price channels, trendlines, and similar tools. For the most accurate results, it is advisable to analyze the trend across multiple timeframes.
Step 2: Identify the appearance of a bullish reversal candlestick
Each bullish reversal candlestick has its own distinguishing characteristics, which help investors recognize which pattern is forming. It is important to note that bullish reversal candlestick patterns tend to be more reliable when they appear at strong support or resistance levels, or at key price zones.
Step 3: Combine bullish reversal candlestick patterns with other tools
Investors should not rely on a single indicator when making trading decisions. Instead, they should combine bullish reversal candlestick patterns with other technical tools. Some effective tools include double top patterns, RSI, MACD, and observing the candle that forms after the reversal pattern.
Step 4: Place the trade
After combining various tools to analyze price trends, investors can place trades based on the projected market direction. When a bullish reversal candlestick pattern appears, place a BUY order.
Notes to trade bullish reversal candlestick patterns more effectively
Below are several important points that traders must keep in mind when applying bullish reversal candlestick patterns:
- Traders should wait for the candle to close in order to accurately confirm a bullish reversal candlestick.
- Timeframes that make it easier to identify candle closing times include M1, M5, M15, M30, H1, W1, and MN.
- Higher trading timeframes such as H4 and D1 are usually more difficult to determine exact candle closing times.
- Investors must always set stop-loss and take-profit levels to minimize risk and optimize returns.
- To improve effectiveness, bullish reversal candlestick patterns should be combined with other technical analysis tools such as trendlines, moving averages (MA), RSI, and support and resistance levels.
Conclusion
Above is a list of the most common and powerful bullish reversal candlestick patterns, along with the principles and trading steps that investors need to understand. Tipstrade.org hopes this article will help investors effectively apply bullish reversal candlestick patterns, make accurate trading decisions, and achieve higher profits.