
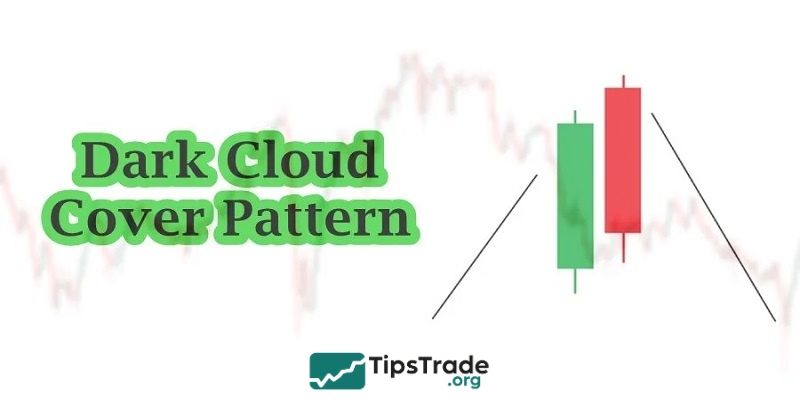
The Dark Cloud Cover candlestick pattern is a bearish reversal signal on price charts. It is a pattern with relatively reliable signal quality, yet it is not widely known among investors. So, what exactly is the Dark Cloud Cover pattern? What are its key characteristics and how can it be traded effectively? All of these questions will be addressed in the following article by Tipstrade.org.
What is a Dark Cloud Cover candlestick?
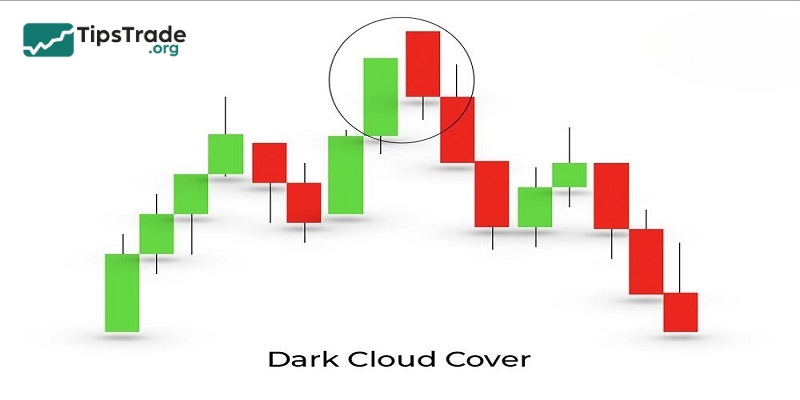
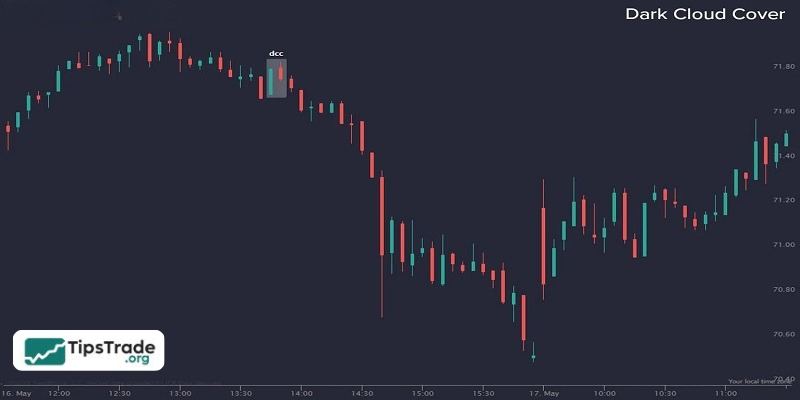
The Dark Cloud Cover candlestick is one of the patterns that signals a potential reversal from an uptrend to a downtrend. This pattern typically appears near the end of an upward price trend; however, many investors fail to recognize it due to a lack of awareness.
The Dark Cloud Cover pattern is a variation of the Bearish Engulfing candlestick; however, it is not considered a perfect formation because the body of the second candle does not fully engulf the body of the first candle as in a Bearish Engulfing pattern. Therefore, this pattern is less reliable than the Bearish Engulfing pattern, but the quality of its signals remains quite high.
Related posts:
- What Is a Morning Star Candlestick & How to Trade It
- What is a Bullish Engulfing candlestick and how to trade it?
- How to Trade with the Piercing Candlestick Pattern Effectively
- Characteristics and how to identify the Tweezer candlestick pattern
How to identify the Dark Cloud Cover candlestick
Below are some important characteristics that can help you recognize dark cloud cover candlestick:
- Position on the chart: The two candles must appear at the top of an established (preferably prolonged) uptrend.
- Color: Depending on your chart settings, the first candle must be green or white, and the second candle must be red or black.
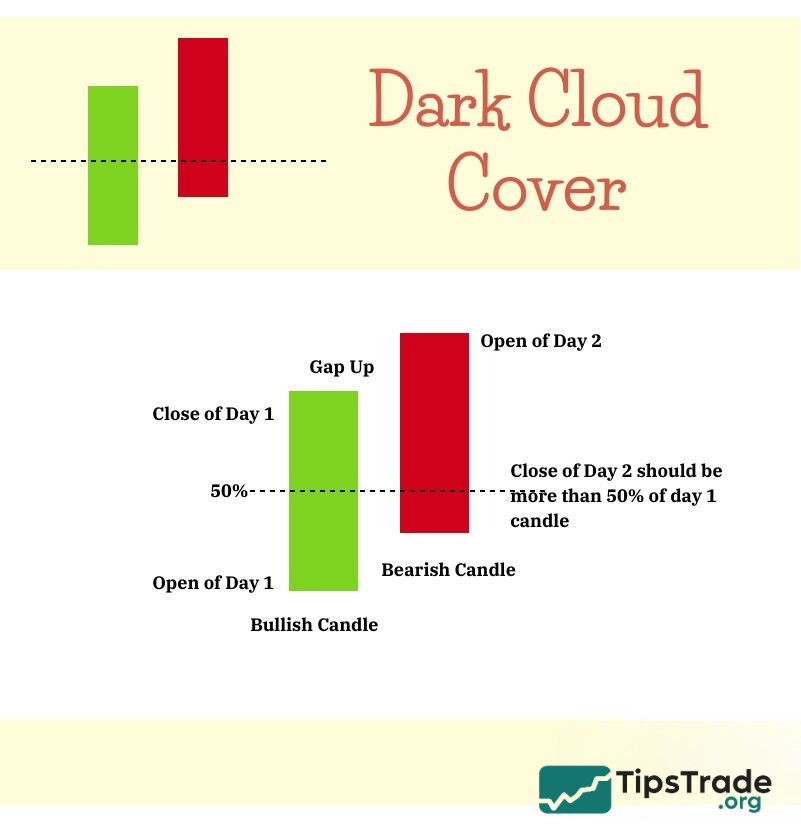
- First candle: A relatively long bullish green candle with a large body, preferably with short or no shadows.
- Second candle: A relatively long bearish red candle that closes below the midpoint (50%) of the first candle’s body.
- Gap up: The second candle’s opening price must be above the closing price of the first candle, creating a noticeable gap, which initially suggests a continued bullish trend, only to be overwhelmed by bearish momentum and ultimately fail by closing below the midpoint of the first candle.
Psychology of the Dark Cloud Cover candlestick
The Dark Cloud Cover candlestick pattern clearly reflects investor psychology. With just two candlesticks appearing near the end of an uptrend, we can “read” investor behavior as follows:
- The first candlestick: This is a strong bullish candle that forms near the end of the uptrend. Some investors have already started taking profits at this point. The length of the upper shadow is proportional to the amount of profit-taking.
- The second candlestick: This is a bearish candle that signals a defensive mindset among investors. Strong selling pressure across the market drives prices sharply lower, thereby confirming the Dark Cloud Cover pattern.
Investors who bought at lower price levels may secure a relatively decent profit; however, those who entered at the first candlestick or one session earlier are unable to cut losses or sell at breakeven. When the stock retreats just as negative news spreads, it tends to face heavy selling pressure.
Investor sentiment shifts from enthusiastic chase buying: unaware that the uptrend is nearing its end to panic selling once the Dark Cloud Cover pattern is recognized.
How to trade the Dark Cloud Cover candlestick
A structured approach helps traders use this pattern more effectively.
Spot the pattern: Look for the two-candle structure during an uptrend.
Wait for confirmation: Examples of acceptable confirmation:
- A third bearish candle
- Break below a support level
- A breakdown under a short-term moving average (10-EMA, 20-EMA)
- Bearish divergence on indicators such as RSI or MACD
Confirmation helps filter out noise and false reversals.
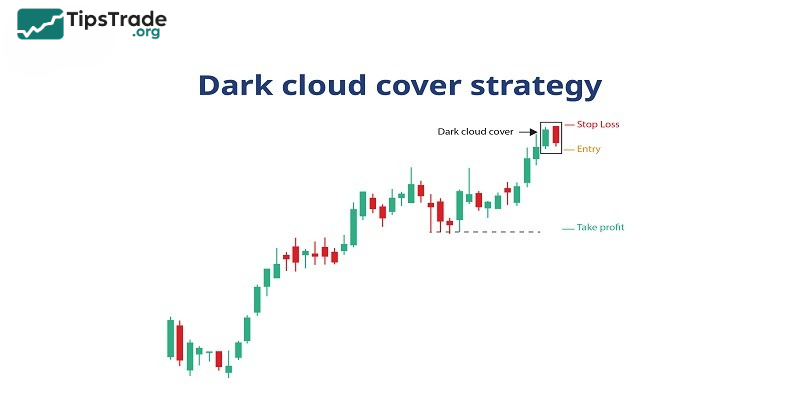
Determine trade direction: If confirmed:
- Exit long positions
- Consider entering short positions
- Adjust exposure if the market conditions appear unstable
Entry options
- Enter after the confirmation candle closes
- Enter on a retest of the breakdown level
- Enter below the low of the Dark Cloud Cover candle
Stop loss placement: Set the stop-loss above the high of the second candle (or above the pattern’s high).
Profit targets: Possible targets:
- Nearest support
- Previous swing low
- Fibonacci retracement level
- Risk-reward ratio such as 1:2 or 1:3
Real example of the Dark Cloud Cover candlestick
Consider a stock that has risen steadily for several sessions:
- A strong bullish candle forms, showing continued buying pressure.
- The next session opens above the previous high, indicating optimism.
- Sellers take control and push the candle to close well below the midpoint of the previous candle.
- A subsequent bearish candle confirms the reversal.
- The trader exits long positions and sets a stop-loss above the pattern’s high.
- Price starts declining toward support zones.
- This illustrates how the pattern serves as a clear early warning.
Advantages and limitations of the Dark Cloud Cover candlestick
Here are some advantages and limitations of this Dark Cloud Cover candlestick:
| Advantages of the Dark Cloud Cover candlestick |
|
| Limitations of the Dark Cloud Cover candlestick |
|
Final word
The Dark Cloud Cover candlestick pattern has been clearly explained in the above article. Investors should thoroughly understand how to trade this pattern and combine it with technical indicators such as RSI, MACD, as well as support and resistance levels to make more informed decisions. Be sure to regularly update your financial knowledge with Tipstrade.org!
Related posts:
- Spinning Top Candlestick and How to Apply It in Technical Analysis
- Shooting Star Candlestick Pattern: How to Identify and Trade It Effectively
- Marubozu Candlestick: A Detailed Guide to Identification and Effective Trading
- What is a Doji candlestick pattern? Common Doji candlestick patterns in investing