
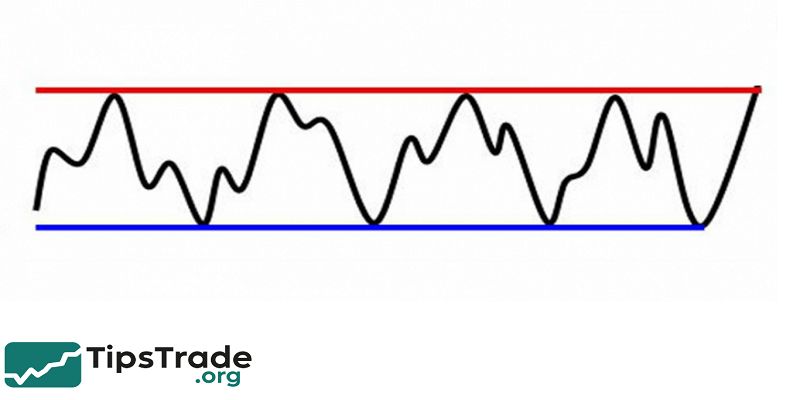
Range bound market refers to a price movement that oscillates between a defined support level and resistance level without forming a clear trend. Instead of moving upward (uptrend) or downward (downtrend), the price stays inside a horizontal channel, creating predictable highs and lows. According to a study by the CMT Association, nearly 70% of market time is spent in consolidation phases, making range-bound strategies essential for long-term success. This guide explains how range-bound markets work, why they occur, and the best strategies to navigate them using technical analysis, momentum tools, and risk management principles. Visit tipstrade.org and check out the article below for further information
Understanding a Range Bound Market
A range-bound market describes a price environment where the asset cannot break above resistance or below support for an extended period.
This sideways condition happens when the market lacks new catalysts, investor sentiment is neutral, or supply and demand remain balanced.
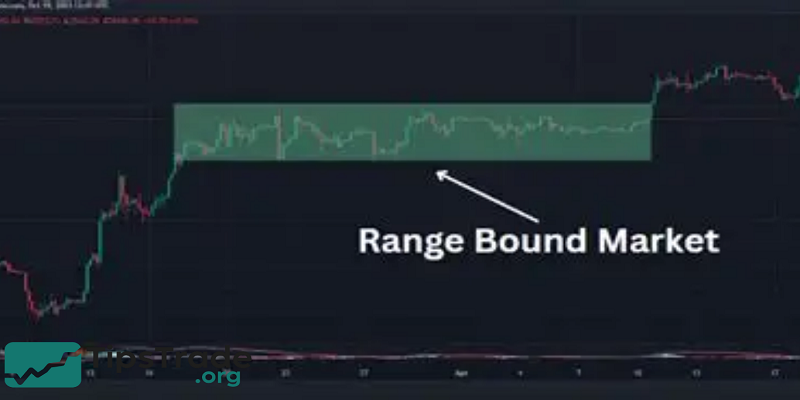
In real-world trading, range-bound periods often appear after strong trends, when the market pauses to “breathe.” Many traders—especially beginners—mistakenly assume that ranges are untradeable, but they actually offer clear, repetitive setups.
When price respects a horizontal range, traders gain predictable entry levels, known risk, and a measurable reward-to-risk ratio. For example, when Bitcoin remained between $29,000 and $31,000 for several weeks in 2023, day traders used this range to scalp predictable bounces.
A range-bound market is also a period where indicators such as RSI, MACD, and Bollinger Bands behave differently compared to trending markets. Understanding these shifts allows traders to filter out noise and reduce false breakout attempts.
Recognizing a range early can help prevent unnecessary losses and improve trade timing.
Key Characteristics of a Range Bound Market
Range-bound structures share several identifiable traits that make them easier to trade. The first is horizontal support, where buying pressure repeatedly pushes price upward.
The second is horizontal resistance, where selling pressure prevents further gains. Together, these two levels create a “box” or “price channel.” Another characteristic involves declining volume, which signals weak interest from buyers and sellers.
This often precedes major announcements, earnings reports, or macroeconomic events. Additionally, range-bound markets typically exhibit oscillating momentum, where indicators like RSI move between overbought and oversold levels more frequently.
Price action also creates repetitive candlestick patterns such as pin bars, rejection wicks, or inside bars.
Finally, range-bound environments show shorter market swings, reduced volatility, and smaller candle bodies. These traits help traders quickly recognize consolidation and adapt strategies.
The clearer these characteristics appear, the easier it becomes to trade the range effectively while avoiding premature breakout trades.
Support and Resistance Levels
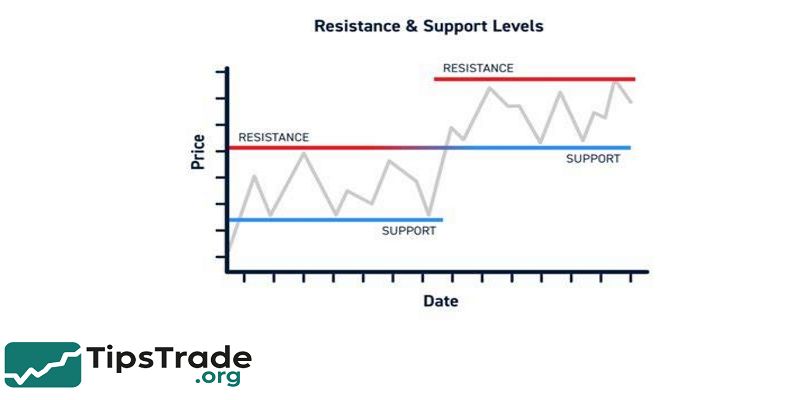
Support and resistance form the backbone of a range-bound pattern. Support represents the price floor where buyers are consistently willing to enter the market, preventing further decline.
Resistance represents the ceiling where sellers dominate, stopping upward momentum. A strong range forms only when price respects these levels multiple times. For example, a stock repeatedly bouncing off $50 and failing to break above $55 is likely moving inside a stable range.
Traders use these boundaries to identify high-probability entry and exit points. Tools like horizontal lines, volume profile, and pivot points help plot accurate levels. Support and resistance gain strength when accompanied by high trading volume or occurring at previous historical zones.
Breakouts from these boundaries can lead to significant moves, but many breakouts fail due to low volume or liquidity.
Understanding the structure of support and resistance helps traders pinpoint reversals, build confidence in entries, and manage trades with clearer stop-loss placements.
Volume Patterns in Range Bound Conditions
Volume behavior provides critical insight into whether a range-bound structure is strong or likely to break.
In most sideways markets, trading volume gradually decreases as the market consolidates. This decline indicates a lack of enthusiasm from both bulls and bears. However, sudden volume spikes near support or resistance often reveal institutional activity. For instance, a high-volume rejection at resistance suggests strong sellers defending the zone.
Conversely, rising volume at support may signal renewed buying pressure. Traders also observe volume during potential breakout attempts.
A breakout with weak volume usually fails, resulting in a false breakout or whipsaw. Data from Nasdaq and FX volume reports indicate that over 60% of breakouts during low-volume sessions reverse back into the range.
Monitoring volume helps traders judge breakout validity, anticipate reversals, and avoid entering at the wrong time. Effective use of volume analysis provides an edge in range-bound markets where price signals alone may be misleading.
Why Markets Become Range Bound
Markets become range-bound due to a variety of fundamental and psychological factors. One of the most common causes is market indecision, where buyers and sellers temporarily reach equilibrium.
Economic uncertainty, lack of news, or anticipation of major reports such as FOMC meetings often contribute to sideways price action. Another reason is trend exhaustion—after a strong rally or sell-off, the market needs time to consolidate before choosing the next direction.
Institutional investors may also manipulate prices to accumulate or distribute positions quietly, creating predictable highs and lows.
For example, before earnings season, many stocks move sideways as investors wait for clarity. Additionally, liquidity constraints can lead to narrow trading ranges, especially in forex pairs or small-cap stocks.
Behavioral economics shows that traders often hesitate to commit during uncertain periods, reinforcing the sideways movement. Understanding why ranges form allows traders to prepare for shifts in volatility and anticipate the next breakout direction.
Types of Range Bound Markets
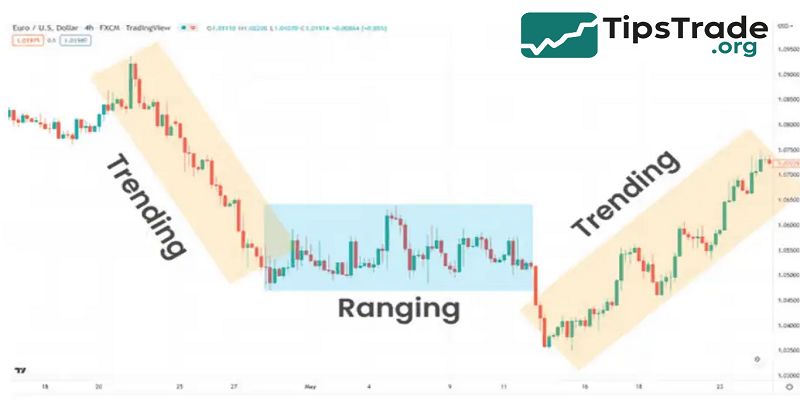
Range-bound conditions appear in several forms, each offering unique trading implications. The first type is the horizontal range, where support and resistance remain steady. This is the most common and easiest to trade.
The second type is a tilted or diagonal range, where price moves sideways but gradually slopes upward or downward, forming a channel.
The third type is the volatile range, where price swings inside the boundaries but with wide fluctuations, commonly seen in crypto.
Finally, there are compression ranges, also known as squeeze patterns, where volatility declines sharply before a major breakout.
These ranges often appear before earnings, interest rate decisions, or major news. Identifying the type of range helps traders choose appropriate strategies—scalping, swing trading, or breakout trading.
The clearer the structure, the easier it becomes to adapt. Each range type reflects different market emotions, from uncertainty to accumulation, offering insights into future price direction.
Trading Strategies for Range Bound Markets
Trading a range-bound market requires discipline, precision, and understanding of key price zones. The most popular strategy is buying at support and selling at resistance, using tight stop losses.
Traders often look for price confirmation such as candlestick patterns, RSI divergence, or volume spikes. Another effective approach is mean-reversion trading, assuming price will return to the middle of the range after hitting extremes.
Indicators like Bollinger Bands help identify these turning points. Additionally, traders use range breakouts to capture strong moves once price leaves the channel.
Breakout traders emphasize volume, retests, and market sentiment to reduce fakeouts. Some advanced traders also combine multiple time frames to refine entries.
For example, a trader might confirm a 4-hour range using 15-minute signals for precision scalps.
Effective risk management is essential since tight ranges can produce rapid reversals. These strategies help traders exploit repetitive behaviors unique to sideways markets.
Mean Reversion Strategies
Mean reversion is one of the most reliable techniques in a range-bound environment. The concept is based on the idea that price tends to return to its average value after reaching extremes.
Traders use tools such as Bollinger Bands, Keltner Channels, and moving averages to identify overextended price points. For example, in forex trading, when EUR/USD repeatedly touches the upper Bollinger Band while RSI approaches 70, traders expect a reversal toward the midline.
This strategy works best when the range is well-defined and market volatility is moderate. Mean-reversion traders often rely on additional confirmation through candlestick patterns like hammers or engulfing formations.
According to research published by the CFA Institute, mean-reversion trades perform exceptionally well in markets without strong macroeconomic trends.
The key to success lies in timing entries accurately and applying small but consistent profit targets. Mean reversion helps traders capitalize on repetitive market behavior while minimizing risks associated with breakouts.
Breakout and Fakeout Dynamics
Breakouts occur when price moves beyond established support or resistance levels, signaling a potential new trend. However, in range-bound markets, false breakouts—also called fakeouts—are common.
A fakeout happens when price briefly breaks a boundary but quickly returns to the range. Many traders lose money by entering prematurely without confirming momentum. To distinguish real breakouts from fake ones, traders analyze volume, candle closures, and retests.
A real breakout usually features strong volume expansion, a decisive candle close beyond the level, and a successful retest of the broken zone. In contrast, weak volume or long-wick candles often indicate traps set by liquidity-seeking institutions.
Studies from various trading journals show that over 50% of breakout attempts within low-volatility ranges fail. Understanding these dynamics helps traders wait for confirmation instead of reacting emotionally.
Proper breakout analysis reduces losses, improves entry accuracy, and prevents getting caught in whipsaw movements common in consolidation phases.
Technical Indicators for Range Bound Analysis
Certain technical indicators perform significantly better in sideways markets than trending conditions. RSI is one of the most widely used tools because it highlights overbought and oversold levels.
Traders commonly enter long positions at RSI 30 and short positions at RSI 70 within a range. Another valuable indicator is Bollinger Bands, which contract during low volatility and expand during breakouts.
Bollinger Bands help identify turning points when price touches the upper or lower band. Stochastic Oscillator also works well due to its sensitivity to momentum shifts. Additionally, moving averages, especially the 20-EMA or 50-SMA, provide mid-range reference points.
In horizontal ranges, price frequently crosses these averages, signaling mean-reversion opportunities. Volume indicators such as OBV (On-Balance Volume) and Volume Profile also offer clues about accumulation.
By combining these tools, traders increase their probability of finding reliable entries and filtering out noise, making range trading more predictable and manageable.
Best Indicators for Sideways Markets
While many traders rely on trend-based indicators, sideways markets require tools designed for oscillation.
The Relative Strength Index (RSI) is a top choice because it effectively identifies potential reversals in low-volatility conditions. The Stochastic Oscillator is even more sensitive, often giving earlier signals during momentum shifts.
Bollinger Bands help identify price extremes—when price touches the band limit, a reversion is likely. MACD, although primarily trend-focused, becomes valuable when traders use histogram signals instead of crossovers.
The ADX (Average Directional Index) is also useful because a reading below 20 confirms a weak trend, validating a range-bound environment.
Experienced traders often combine RSI with ADX to filter out low-probability setups. These indicators work best when paired with strong support and resistance analysis rather than used alone.
Practical use requires patience and consistent validation, especially when dealing with potential breakouts or false signals.
Pros and Cons of Trading Range Bound Markets

Range-bound markets offer unique opportunities but come with challenges. One major advantage is predictability—support and resistance levels provide clear entry zones, allowing traders to define risk precisely.
Another benefit is lower volatility, which makes ranges suitable for beginners or risk-averse traders. Range trading also allows frequent trades without relying on strong trends.
However, the biggest challenge is the high chance of false breakouts, which can lead to quick losses. Tight ranges may also produce whipsaws—rapid reversals that stop traders out early.
Additionally, narrow price movement limits potential profit unless traders use leverage or larger positions, which increases risk. Certain indicators may generate conflicting signals, making decision-making difficult.
Moreover, sudden news events can break ranges violently. While range-bound conditions offer stable setups, they require patience, strict discipline, and advanced risk management to avoid unnecessary losses
Common Mistakes Traders Make in Range Bound Markets

Many traders misinterpret sideways markets, leading to avoidable losses. A common mistake is chasing breakouts without confirmation, resulting in whipsaw entries.
Another error is trading too frequently, assuming each bounce or rejection will produce the same movement. Over-reliance on trend-based indicators like MACD or moving average crossovers also causes confusion in horizontal markets.
Some traders fail to adjust stop-loss levels for tight ranges, resulting in premature exits. Others misjudge the strength of support and resistance, entering trades too early. Failing to monitor volume or news events also leads to surprise breakouts.
Impatience is another challenge—traders often get frustrated with slow movement and take impulsive trades.
Successful range trading requires discipline, patience, and strategic planning. Avoiding these mistakes improves win rates and builds long-term consistency.
Conclusion
Range Bound markets are crucial to understand because they indicate periods when prices move within a specific horizontal range without clear trends. These phases help traders identify consolidation where buying and selling pressures balance out. Recognizing Range Bound conditions allows investors to apply appropriate strategies, such as range trading or waiting for breakout signals. Understanding this market behavior improves decision-making and risk management for both short-term and long-term trading.