
Debt To Equity Ratio is one of the most essential financial metrics investors and analysts use to evaluate a company’s financial leverage. Understanding this ratio helps businesses maintain a healthy balance between debt and equity, ensuring long-term stability and sustainable growth. Whether you are a business owner, investor, or financial analyst, knowing how to interpret the D/E ratio can significantly influence your decisions. Visit tipstrade.org and check out the article below for further information
What Is Debt to Equity Ratio?

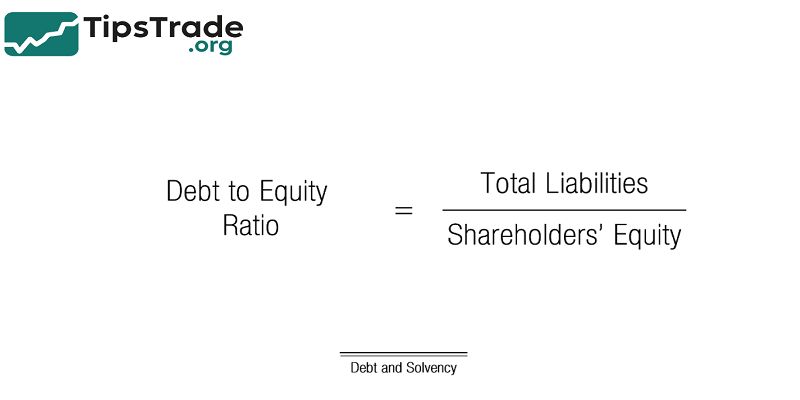
The Debt-to-Equity Ratio measures the relationship between a company’s total liabilities and its shareholders’ equity. It represents how much debt a company is using to fund its assets relative to the value of shareholders’ investments.
Formula:
- Debt−to−EquityRatio=TotalLiabilitiesShareholders’EquityDebt-to-Equity Ratio = \frac{Total Liabilities}{Shareholders’ Equity}Debt−to−EquityRatio=Shareholders’EquityTotalLiabilities
- For example, if a company has $500,000 in total liabilities and $250,000 in shareholders’ equity, the D/E ratio is 2.0. This means the company uses $2 of debt for every $1 of equity.
A higher D/E ratio indicates greater financial risk because the company relies more heavily on borrowed funds, while a lower ratio suggests financial stability and conservative financing.
Components of Debt and Equity
To calculate the ratio accurately, it’s essential to understand what “debt” and “equity” include:
| Component | Description |
| Total Debt (Liabilities) | Includes both short-term and long-term obligations such as loans, bonds, leases, and accounts payable. |
| Shareholders’ Equity | The net value owned by shareholders, including common stock, retained earnings, and additional paid-in capital. |
It’s important to use consistent accounting standards.
For example, financial institutions often carry more debt as part of their business model, so a “normal” D/E ratio for them may look high compared to manufacturing firms.
How to Calculate Debt-to-Equity Ratio
Here’s a simple 3-step approach:
- Find total liabilities on the company’s balance sheet.
- Identify shareholders’ equity, including retained earnings and common stock.
- Divide total liabilities by equity to get the ratio.
Example:
| Item | Amount |
| Total Liabilities | $600,000 |
| Shareholders’ Equity | $400,000 |
| Debt-to-Equity Ratio | 1.5 |
This result means that for every $1 of equity, the company uses $1.5 in debt.
Ideal Debt-to-Equity Ratio: What Is Considered Good?
There’s no universal “perfect” ratio. The acceptable range depends on the industry, business model, and risk appetite:
| Industry | Typical D/E Range |
| Technology / Software | 0.3 – 0.6 |
| Manufacturing | 1.0 – 2.0 |
| Banking / Financial | 2.0 – 5.0 |
| Retail | 0.5 – 1.5 |
In general:
- Low D/E ratio → conservative structure, less risk, but limited growth potential.
- High D/E ratio → aggressive strategy, higher risk, potential for faster expansion.
As Investopedia notes, a ratio below 1.0 is often viewed as financially sound, but this can vary depending on capital intensity.
Why the Debt-to-Equity Ratio Matters
The D/E ratio provides critical insights into a company’s financial health and risk management. Here’s why it matters:
- For Investors: Indicates how much risk is tied to the company’s capital structure.
- For Lenders: Determines creditworthiness and repayment ability.
- For Management: Helps decide how to finance new projects or expansions.
- For Analysts: Allows comparison across firms and industries to assess efficiency.
Companies with extremely high D/E ratios may struggle during downturns, while those with balanced ratios can weather financial challenges more easily.
Advantages of Using Debt-to-Equity Ratio
- Clear leverage indicator: Simplifies complex financial data into one meaningful figure.
- Helps manage risk: Shows if the company is over-leveraged or underutilizing debt.
- Supports decision-making: Guides strategies for borrowing, investment, or dividend policies.
- Benchmarking tool: Useful for comparing companies within the same sector.
By consistently tracking D/E ratios, companies can make informed choices about financing mix and avoid liquidity issues.
Limitations of Debt-to-Equity Ratio

While useful, the ratio has limitations:
- Industry differences: A “high” ratio may be normal in some sectors.
- Accounting variations: Different accounting standards affect how debt and equity are measured.
- Doesn’t reflect cash flow: A firm might have high D/E but strong cash reserves.
- Ignores asset quality: Doesn’t consider how efficiently assets are used to generate returns.
Thus, the D/E ratio should always be analyzed alongside other financial ratios such as interest coverage, current ratio, or return on equity (ROE).
Debt-to-Equity Ratio vs. Other Financial Ratios
Here’s how D/E compares to other key leverage metrics:
| Ratio | Measures | Formula | Focus |
| Debt-to-Equity | Leverage between debt and equity | Liabilities ÷ Equity | Long-term solvency |
| Debt Ratio | Debt as part of total assets | Liabilities ÷ Assets | Overall leverage |
| Equity Ratio | Shareholders’ equity as part of assets | Equity ÷ Assets | Financial independence |
| Interest Coverage Ratio | Ability to pay interest | EBIT ÷ Interest Expense | Short-term debt servicing |
A well-rounded financial analysis should use multiple ratios for accuracy.
How to Improve Debt-to-Equity Ratio

If a company has an unhealthy D/E ratio, it can take the following steps:
- Increase equity through new share issuance or retained earnings.
- Reduce liabilities by repaying high-interest debt.
- Boost profits to strengthen the equity base.
- Convert debt to equity through restructuring or investor agreements.
- Optimize cash flow management to reduce dependency on borrowing.
Practical Tips for Investors
When analyzing a company’s D/E ratio:
- Compare with industry averages, not absolute numbers.
- Check trends over time to see if leverage is increasing or decreasing.
- Review notes in financial statements for hidden liabilities.
- Combine with metrics like ROE, ROA, and EBITDA margin for full context.
An informed investor looks beyond numbers and examines the company’s strategic context.
Conclusion
Debt to Equity Ratio is a crucial indicator of a company’s financial leverage and risk level. It shows the proportion of debt financing relative to shareholders’ equity, helping investors understand how much risk a company is taking to fund its operations. Monitoring the Debt to Equity ratio allows for better assessment of a company’s stability and long-term solvency.