
Profitability Ratios are essential financial metrics used to evaluate a company’s ability to generate profit relative to its revenue, assets, or equity. These ratios help investors and managers assess the efficiency and effectiveness of a business in creating value. Understanding Profitability Ratios is crucial for making informed decisions about investment, management strategies, and financial health. Visit tipstrade.org and check out the article below for further information
What Are Profitability Ratios?
Definition & Purpose
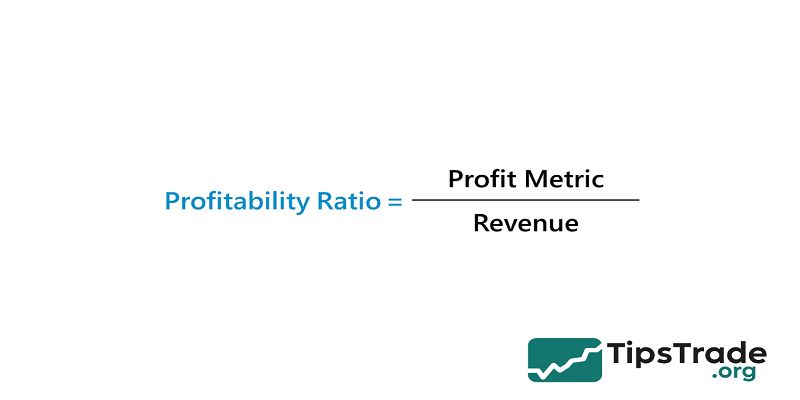
Profitability ratios are financial metrics used to evaluate how efficiently a company generates profit relative to its revenue, assets, or equity. These ratios provide investors and managers with a snapshot of a company’s ability to create value and sustain long-term growth.
For instance, metrics such as gross profit margin or return on assets (ROA) indicate whether the company converts its sales and resources into actual profit effectively. According to Investopedia, profitability ratios are a cornerstone of financial analysis because they summarize a firm’s core performance without external noise like financing or accounting methods.
Why They Matter for Investors & Managers
For investors, profitability ratios serve as a quick benchmark to compare companies across industries.
A high net profit margin, for example, may indicate a competitive advantage, efficient cost control, or pricing power.
Managers, on the other hand, rely on these ratios to measure internal performance. If the operating profit margin declines year-over-year, it might signal inefficiencies or rising expenses.
As noted by CFI (Corporate Finance Institute), profitability ratios also play a crucial role in credit analysis—banks often use them to assess loan eligibility and repayment capability. Simply put, strong ratios translate to financial health and investor confidence.
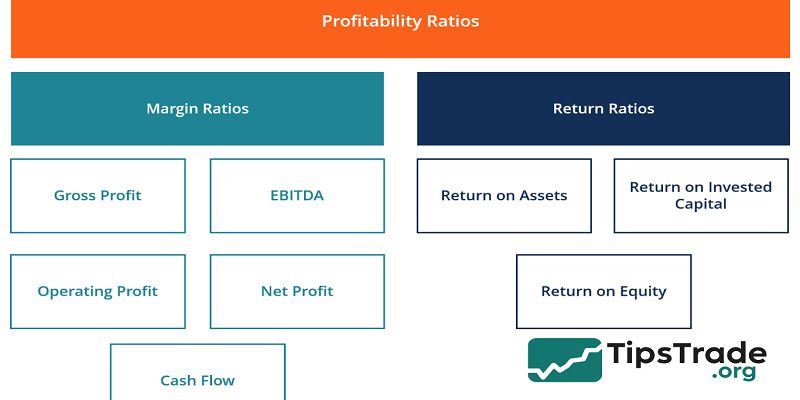
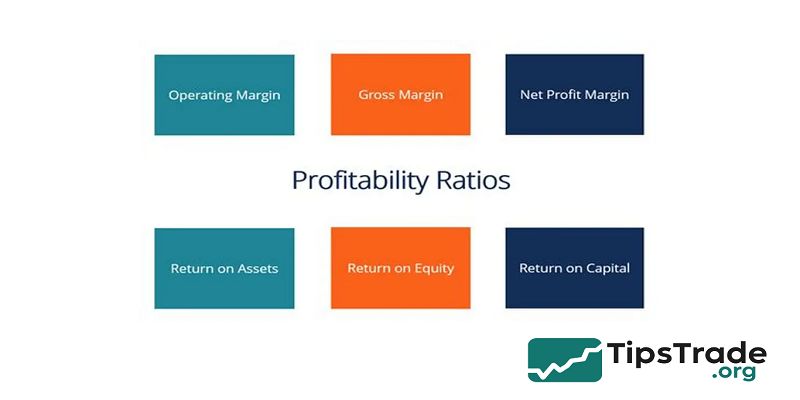
Key Types of Profitability Ratios
Margin Ratios (Gross, Operating, Net, Cash Flow)
Margin ratios focus on different stages of profit generation—from sales to final net income. The most common include:
| Ratio | Formula | Key Insight |
| Gross Profit Margin | (Revenue – COGS) / Revenue | Measures how efficiently a company produces goods relative to cost. |
| Operating Margin | Operating Income / Revenue | Evaluates efficiency after operating expenses. |
| Net Profit Margin | Net Income / Revenue | Reflects overall profitability after all costs, taxes, and interest. |
| Cash Flow Margin | Operating Cash Flow / Revenue | Indicates real cash conversion ability. |
For example, a retail company with a 50% gross margin but only 5% net margin might have heavy administrative or marketing costs. Understanding each layer helps pinpoint where profits are leaking.
Return Ratios (ROA, ROE, ROIC, ROCE)
While margin ratios measure profit relative to sales, return ratios measure profit relative to resources used.
- Return on Assets (ROA) = Net Income / Total Assets → shows how effectively assets generate profit.
- Return on Equity (ROE) = Net Income / Shareholder Equity → reveals how much profit shareholders earn for every dollar invested.
- Return on Invested Capital (ROIC) = NOPAT / Invested Capital → measures efficiency of both debt and equity financing.
- Return on Capital Employed (ROCE) = EBIT / Capital Employed → evaluates long-term profitability.
For example, a company with a 20% ROE may appear strong—but if its debt ratio is high, the figure might be inflated. ACCA Global recommends analyzing several return ratios together to get a balanced view.
How to Calculate & Interpret Profitability Ratios
Step-by-Step Calculation Guide
To calculate profitability ratios accurately, analysts rely on data from income statements and balance sheets.
Example:
Let’s say Company A reports:
- Revenue: $1,000,000
- COGS: $600,000
- Operating Income: $250,000
- Net Income: $180,000
- Total Assets: $1,200,000
- Equity: $800,000
Then:
- Gross Margin = (1,000,000 – 600,000) / 1,000,000 = 40%
- Operating Margin = 250,000 / 1,000,000 = 25%
- Net Profit Margin = 180,000 / 1,000,000 = 18%
- ROA = 180,000 / 1,200,000 = 15%
- ROE = 180,000 / 800,000 = 22.5%
Each number tells part of the story: margins reflect operational health, while ROA/ROE show how effectively assets and equity generate value.
What the Numbers Tell You – Benchmarks & Industry Context
Profitability ratios don’t exist in isolation. A 10% net margin might be excellent for a grocery chain but below average for a software company.
Industry benchmarks help contextualize results. According to Datarails 2024 Financial Report, the average net margin for U.S. manufacturing firms hovers around 7%, while tech firms average 20%+.
Moreover, trends matter more than single snapshots. An improving margin trend over several quarters signals efficiency gains, whereas a sudden drop may warrant investigation. Always compare ratios across time and against industry peers for meaningful insights.
Real-World Application & Limitations
Using Profitability Ratios for Business Decisions
Profitability ratios are practical tools for strategic decision-making. Business owners can identify underperforming divisions, price inefficiencies, or cost leakages.
For instance, a logistics company noticing a declining operating margin could renegotiate supplier contracts or optimize fuel usage.
Investors apply these ratios to screen stocks—seeking firms with consistent ROE > 15% or stable net margins over multiple years.
In financial modeling, analysts also use profitability ratios to project future performance or assess merger synergies. As Morningstar highlights, consistent profitability indicates strong management execution and competitive advantage.
Common Pitfalls & Limitations
Despite their usefulness, profitability ratios have limitations.
- Accounting Differences: Companies use varying depreciation methods, making comparisons tricky.
- Industry Variations: Capital-intensive industries (like airlines) naturally have lower ROA than service sectors.
- Short-Term Distortion: One-off events—asset sales, tax changes—can temporarily inflate profits.
- Debt Influence: High leverage can boost ROE artificially.
- Therefore, experts recommend combining profitability ratios with liquidity, efficiency, and leverage ratios for a full financial picture. Always interpret numbers with context and caution.
How to Improve Company Profitability – Actionable Strategies

Operational Efficiency & Cost Management
Improving profitability starts with operational discipline.
- Streamline Production: Automate repetitive tasks or adopt lean manufacturing.
- Optimize Pricing: Review product mix to focus on high-margin offerings.
- Reduce Waste: Monitor COGS and overhead closely.
According to a 2023 McKinsey report, companies that actively track cost drivers improve operating margins by 2–4 percentage points annually.
For example, a mid-size apparel brand increased its net margin from 10% to 14% by outsourcing logistics and renegotiating supplier contracts. Practical, measurable improvements often begin with process optimization.
Asset Utilization & Capital Structure Optimization
Profitability is not just about cutting costs—it’s about using capital wisely.
Firms can raise ROA by selling idle assets or investing in technologies that boost output. Improving inventory turnover also enhances asset efficiency.
Meanwhile, adjusting capital structure—balancing debt and equity—helps stabilize ROE without excessive financial risk.
For instance, Tesla’s 2022 Financial Report showed a jump in ROE from 11% to 17% after improving asset turnover and repaying high-cost debt.
Strategic reinvestment in innovation and sustainable assets can enhance profitability long-term.
Conclusion
Profitability ratios are more than accounting formulas—they’re powerful tools that reveal the financial heartbeat of a business. Whether you’re an investor comparing companies or a manager improving operations, understanding these ratios equips you to make smarter, data-driven decisions.
However, remember that no single metric tells the whole story. Combine profitability analysis with broader financial indicators to gain true insight into business health.
In an increasingly competitive economy, tracking and improving profitability ratios isn’t optional—it’s the key to sustainable success.