
Price Channels are one of the simplest and most visual tools in technical analysis. Instead of relying on complicated algorithms, a price channel uses two parallel lines surrounding price movement: an upper line showing resistance and a lower line showing support. When price stays inside the channel, traders can easily see whether the market is trending upward, trending downward, or moving sideways. Because of this simplicity, price channels are used in stocks, crypto, forex, commodities, and even index trading. Visit tipstrade.org and check out the article below for further information
What Are Price Channels?
A price channel is formed by connecting swing lows to create a lower boundary and connecting swing highs to create an upper boundary.
The space between the two lines becomes the “channel.” As long as price stays inside it, the channel acts like a path price is traveling through. When price breaks outside of this path, traders consider it a breakout signal.
Inside the channel, the lower boundary acts as support—a zone where buyers tend to enter. The upper boundary becomes resistance—where sellers are more active. In trending markets, price often bounces between these two levels multiple times.
For example, when Bitcoin traded between $28,000 and $32,000 for several weeks, traders used the channel to buy near support and sell near resistance. It was not a prediction model; it simply visualized where supply and demand were strongest.
Price channels are especially helpful for beginners because they do not require advanced math or complex indicators. With basic chart drawing, traders can see if the market is moving in a clear direction or if it is ranging sideways.
This visual clarity is one reason many educators teach price channels before introducing more advanced tools like Ichimoku or harmonic patterns.
Why Price Channels Matter in Trading
Price channels offer structure in a chaotic market. Instead of reacting emotionally, traders plan entries and exits based on tested behavior. In technical analysis, markets often repeat patterns because human psychology repeats.
When prices rise toward resistance, traders expect selling pressure. When prices fall toward support, traders expect buyers.
Channels also help manage risk. Traders set stop-loss orders outside the channel. If price breaks and closes beyond the boundary, it signals that the pattern is changing.
For example, a stock trending in a rising channel may break below the lower boundary after negative news. The break warns traders to exit instead of holding and hoping.
According to Nasdaq educational reports, risk-managed channel trading works best with momentum confirmation—such as increasing volume during a breakout or decreasing volume during a pullback.
These factors make channels not just lines on a chart, but part of a systematic approach.
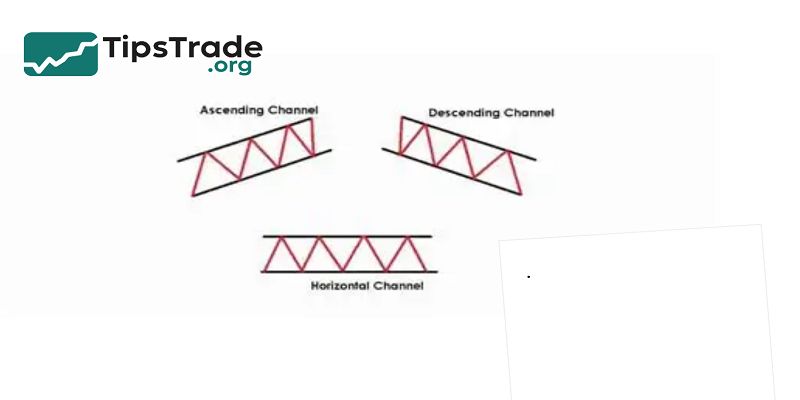
Types of Price Channels
Price channels come in three main types, each representing a different market condition:
| Channel Type | Direction | Meaning |
| Rising / Ascending | Upward | Price making higher highs and higher lows |
| Falling / Descending | Downward | Price making lower highs and lower lows |
| Horizontal | Sideways | Price consolidating without strong trend |
Understanding the type of channel helps traders decide whether they should buy, sell, or stay out.
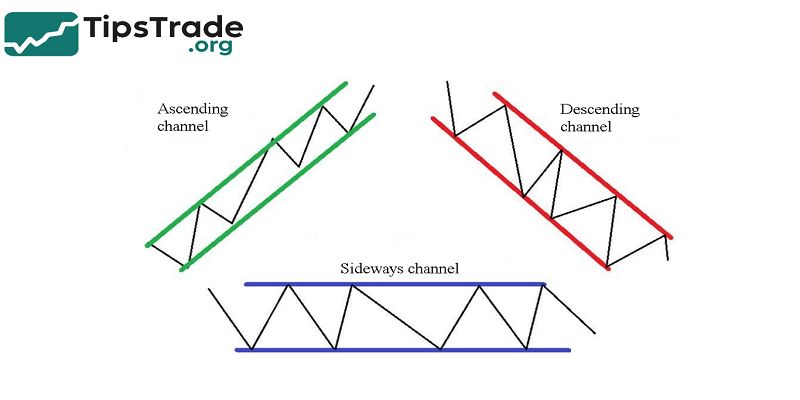
Rising (Ascending) Channel
A rising channel appears when price forms higher lows and higher highs over time. This is a bullish structure.
Traders buy near the lower boundary and target the upper boundary. Trend followers often enjoy rising channels because they show controlled upward movement instead of random spikes.
A practical example: during early 2021, Ethereum formed a rising channel while increasing from $800 to over $3,000.
Each dip to the lower channel line created buying opportunities. Traders who waited for pullbacks instead of chasing the top often got better entries and lower risk.
Ascending channels are reliable in trending markets, but they can break down during news events or when volume fades.
When price breaks below the channel with strong momentum, it may signal a trend reversal. Smart traders watch volume closely; weak volume at the top often means buyers are losing strength.
Falling (Descending) Channel
A falling channel forms lower highs and lower lows—signals of a bearish trend. Traders who short the market sell near the upper boundary and take profit at the lower boundary. In stocks or crypto, falling channels appear during corrections or bear markets.
For instance, after Bitcoin peaked near $69,000 in 2021, it moved into a falling channel for several months.
Every bounce toward the upper line met selling pressure, confirming bearish sentiment. Traders who recognized the channel avoided buying too early and waited for a clean breakout before entering long positions.
Descending channels help traders avoid emotional dip-buying during downtrends.
Just because the price dropped does not mean it is cheap. Many beginners lose money trying to predict the bottom instead of following the trend structure.
Horizontal (Sideways) Channel
A horizontal channel (also called a range-bound market) happens when price moves between parallel support and resistance without a clear trend. This is common after a big move, while the market waits for new information.
Sideways channels can be frustrating because price fakes breakouts and reverses quickly. However, range traders profit by buying low and selling high repeatedly.
For example, when gold ranged between $1,900 and $2,000 for weeks, traders used the channel to scalp small but consistent profits.
Breakouts from horizontal channels are often powerful. When price finally escapes the range, volume usually increases and momentum accelerates.
How to Draw Price Channels Correctly

Drawing channels looks simple, but beginners often draw them incorrectly. A proper channel connects clear swing highs and swing lows with parallel lines.
If the lines are forced or drawn through random candles, the channel loses meaning.
The best practice is to start with a trendline across at least two major lows or highs, then copy the line to the opposite side so both lines are parallel. The more times price touches the lines, the stronger the channel.
On higher timeframes—like the 4H chart or daily chart—channels filter noise more effectively and produce more reliable signals.
Traders should avoid forcing a channel when the price structure does not support it. If the market is too volatile or spikey, it may not be suitable for channel trading.
According to data from FXStreet educational resources, the probability of success increases when channels appear with consistent volume and steady trend strength.
Common Mistakes When Drawing Channels

Beginners often draw channels too tight or too wide. A tight channel causes price to break frequently, creating false signals.
A channel that is too wide provides no real structure. Another mistake is drawing channels on very short timeframes where price noise dominates.
Some traders only draw channels after the pattern is obvious, which creates hindsight bias. Professionals instead build channels early and adjust as the market develops. A channel is not a prediction; it is a guide that evolves with new price data.
Risk management is also important. A channel is not an excuse to enter trades blindly. Smart traders wait for confirmation such as candlestick patterns, RSI divergence, or volume behavior before reacting.
Best Price Channel Trading Strategies
Price channels become powerful when paired with a strategy. Below are three proven approaches used by traders.
Strategy 1 — Buy the Dip / Sell the Rally
In a rising channel, traders buy near the lower boundary. In a falling channel, they sell near the upper boundary. This method works well when the channel is clean and price respects boundaries multiple times.
A real example: Apple stock frequently forms rising channels during earnings seasons. Swing traders wait for pullbacks near the lower boundary instead of buying breakouts at the top. This gives lower risk and better reward.
Stop-loss orders are usually placed just outside the channel to protect against sudden reversals. This keeps losses small while letting the trend continue.
Strategy 2 — Breakout Trading
When price breaks out of a channel with strong volume, a new trend may be starting. Breakouts above a rising channel often signal acceleration. Breakouts below a falling channel may signal a bottom.
However, not every breakout is real. False breakouts are common. Traders check confirmation indicators like:
- RSI overbought/oversold
- MA crossover
- Volume surge
- Retest of the breakout zone
Forex and crypto markets are famous for fake breakouts, so discipline matters. According to a study on breakout strategies published by CME Group, combining volume with breakouts increases success rates significantly.
Strategy 3 — Combine Channels with Indicators
Price channels work best when combined with objective indicators. Some combinations include:
- RSI: shows overbought/oversold inside the channel
- MACD: confirms momentum
- Moving averages: filter direction
- ATR: measure volatility for stop-loss
For example, a trader may buy near the lower channel line only if RSI is below 30 (oversold). This adds probability to the trade and reduces randomness.
Price Channels vs Other Tools
Price channels are often compared to trend lines, Bollinger Bands, and Donchian channels. While all of them measure price movement, their behavior is different.
| Tool | What it measures | Works best in |
| Price Channels | Swing highs & lows | Clean trends |
| Bollinger Bands | Volatility | Sideways markets |
| Donchian Channels | Highest high & lowest low | Breakout systems |
Donchian channels gained fame from the “Turtle Traders,” a group that turned simple breakout rules into millions of dollars. Their strategy was based on buying when price broke the upper Donchian channel and selling when it broke the lower channel. This shows the power of simple channel-based rules.
Pros and Cons of Price Channels
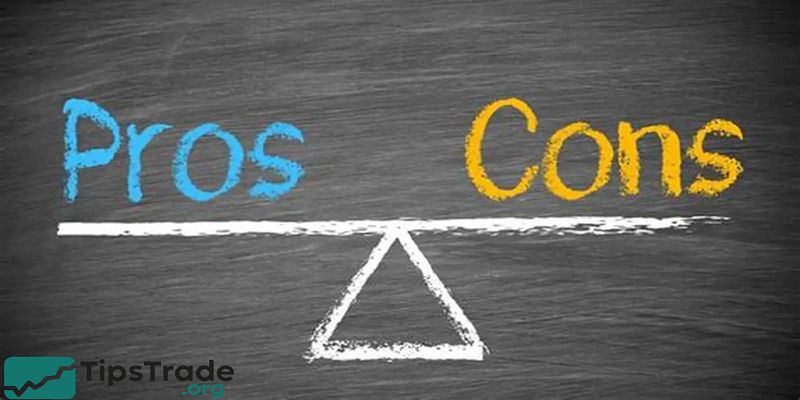
Advantages
- Easy to understand
- Works in all markets (stocks, crypto, forex)
- Helps reduce emotional decisions
- Supports breakout and pullback strategies
Disadvantages
- Not effective in choppy markets
- Can produce false breakouts
- Requires experience to draw correctly
- Not a stand-alone system—needs confirmation
According to research summaries from MarketWatch, combining channels with volume and trend indicators reduces false signals and improves performance.
Conclusion
Price Channels provide a clear and effective technical tool for identifying trends and potential reversal points in financial markets. By defining support and resistance levels through upper and lower channel lines, traders can better time entries and exits with reduced risk. Understanding how to interpret and apply Price Channels enhances market analysis and contributes to more disciplined trading strategies.