
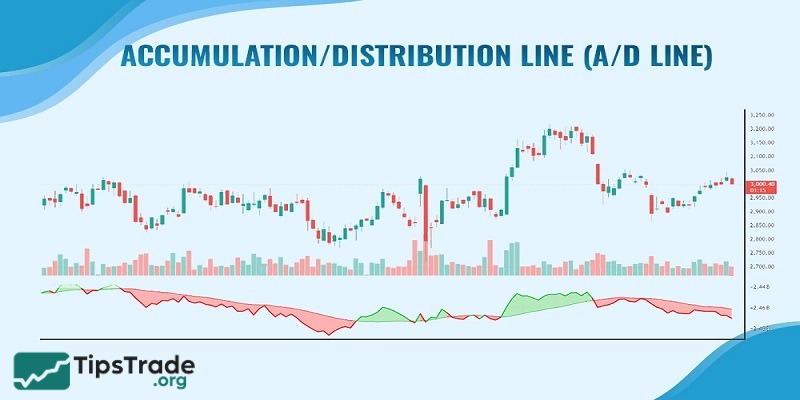
The Accumulation/Distribution line is considered a variant of the OBV indicator. It allows traders to identify buying and selling pressure in the market while also spotting reliable trend reversal points. So, what exactly is the A/D line, and how to use it in trading for getting trading signals? Let’s explore it in more detail in the article below with Tipstrade.org.
What is the Accumulation/Distribution Line?
The Accumulation/Distribution line (A/D) is a technical indicator derived from the On-Balance Volume (OBV) indicator, designed to evaluate the inflow and outflow of money in an asset by combining both price and trading volume data.
Although it shares similarities with the OBV indicator, instead of relying solely on the closing price over a specific period, the A/D line also takes into account the trading range and the position of the closing price within that range. The trading range is determined by the highest and lowest prices, or the bid and ask prices, during a given timeframe.
By combining price movements with trading volume, this indicator helps investors gauge market sentiment and determine whether an asset’s price is currently in an accumulation phase or a distribution phase.
>>See more:
- The Ichimoku Indicator: What It Means and How to Use It
- How to Use the Momentum Indicator when Trading
- Bollinger Bands – An effective technical indicator for investment trading!
- What is Chaikin Money Flow? Learn how to use it for measuring buying and selling pressure
Accumulation/Distribution Line vs. On-Balance Volume
In reality, both the A/D and OBV indicators are indicators of accumulated volume and price. In other words, these two indicators show the level of buying and selling in the trading market. However, to distinguish between these two indicators, the following points should be noted:
|
Aspect |
ADL (Accumulation/Distribution Line) |
OBV (On-Balance Volume) |
|
Created by |
Mark Chaikin |
Joe Granville |
|
Calculation Method |
Utilize the position of the close price in relation to the high-low range and multiplies by volume. |
Adds volume on up days and subtract volume on down days. |
|
Formula Difficulty |
More difficult as it considers price position in the trading range. |
Simple, only consider whether the price is close, lower or higher than previous close. |
|
Focus |
Calculate selling and buying pressure on the basis of price range and volume. |
Measure volume flow on the basis of price direction. |
|
Interpretation |
Positive value signal accumulation (buying) and negative values signal distribution (selling). |
Increasing OBV signifies buying pressure and decreasing OBV signifies selling pressure. |
|
Visualization |
It merges as a line that sums up the amount of money flowing in and out over time. |
It is presented as a line that sums up the total traded in the long run. |
|
Sensitivity |
More sensitive to volume interaction and price. |
Less sensitive; consider volume changes in regards to price movement. |
Formula and calculation of the Accumulation/Distribution Line
The calculation formula for the Accumulation/Distribution (A/D) indicator is quite complex and is defined as follows:
A/D = Previous A/D + CMFV
Here, CMFV stands for Current Money Flow Volume, which represents the current money flow volume.
The CMFV, or more accurately the Money Flow Volume (MFV), is calculated as:
Money Flow Volume = MFM × Volume
In this formula, MFM refers to the Money Flow Multiplier, which must also be calculated separately.

Where:
- Close: The closing price of the current period
- Low: The lowest price of the period
- High: The highest price of the period
Importance of the Accumulation/Distribution Line in trading
Compared to other technical analysis tools, the Accumulation/Distribution Line (ADL) has several distinctive and meaningful characteristics that make it particularly appealing to traders. Here are some key reasons why many traders prefer using this indicator:
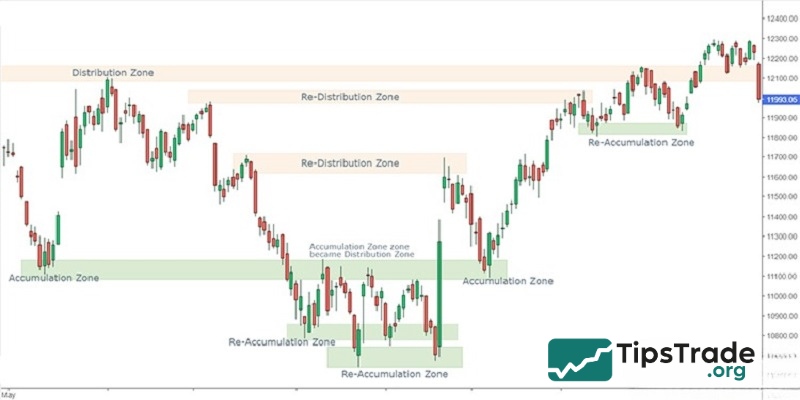
Helps identify market sentiment
The essence of the Accumulation/Distribution line lies in showing how the price of an asset flows in and out of the market. Traders often rely on this indicator to gauge overall market sentiment, as it provides a powerful combination of both price and trading volume data.

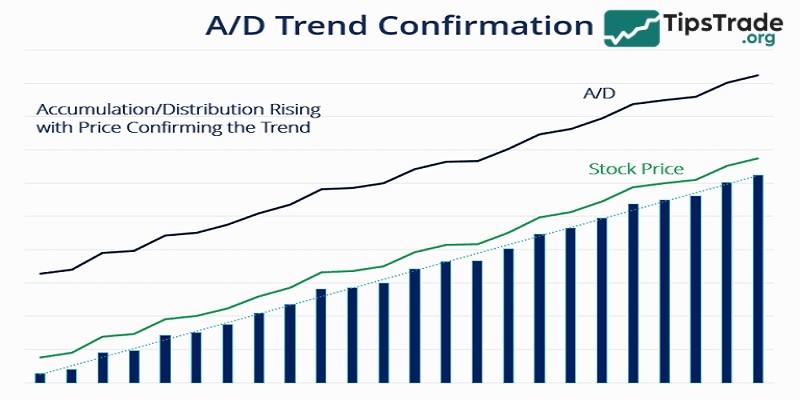
Helps identify the asset’s value trend
Traders can determine the asset’s price trend as follows:
- The market is in an uptrend when the Accumulation/Distribution line is rising, accompanied by increasing prices and high trading volume.
- The market is in a downtrend when the Accumulation/Distribution line is declining, along with falling prices and low trading volume.
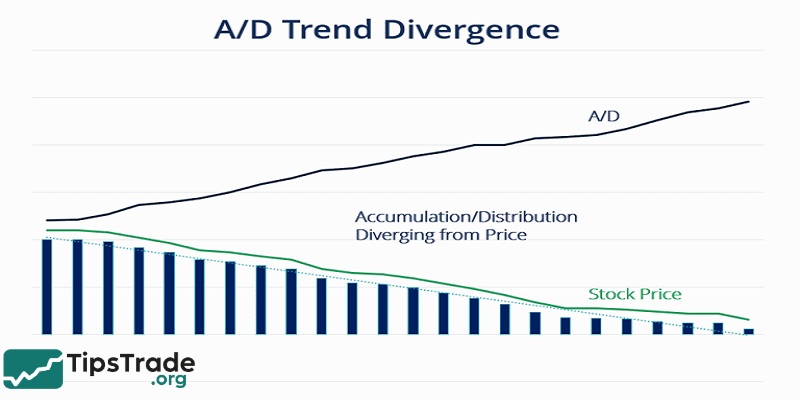
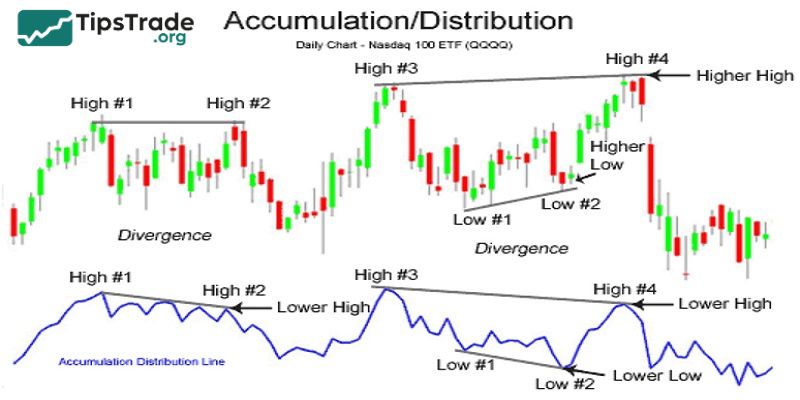
Helps identify potential trend reversals
Investment experts also use the A/D line in conjunction with positive (+) and negative (–) divergences to accurately and effectively identify possible market reversals.
- In the case of negative divergence (–), when the price is decreasing but the A/D line is rising, it indicates strong buying pressure, suggesting a potential upward reversal in asset price.
- In the case of positive divergence (+), when the price is decreasing and the A/D line is also falling, it reflects significant selling pressure, signaling a high probability of a downward reversal.
How to use Accumulation/Distribution Line in trading?
To succeed in trading with the Accumulation/Distribution Line, please refer to the trading instructions below.
Confirming the strength of a price trend
- Traders can anticipate and consider entering a Buy position when the A/D indicator is at a high level. This suggests that the market is experiencing an accumulation phase, with increased buying pressure leading to an upward price trend.
- Conversely, traders may enter a Sell position when the A/D indicator is at a low level, indicating a distribution phase in which selling pressure dominates, resulting in a downward price trend.
Identifying price fluctuations
- Traders can enter Sell positions in either of the following scenarios. First, when a negative divergence (–) occurs while the price is moving in an uptrend, signaling a potential downward reversal. Second, when a negative divergence (–) appears while the price is already in a downtrend, indicating a continuation of the bearish trend.
- Similarly, investors may enter Buy positions when a positive divergence (+) occurs during a downtrend, suggesting a possible upward reversal; or when a positive divergence appears during an uptrend, signaling the continuation of the bullish momentum.
Advantages & Disadvantages of the Accumulation/Distribution Line
Let us now discuss the advantages and disadvantages of the Accumulation/Distribution Line in detail.
Advantages of the Accumulation/Distribution Line
Based on the amount of information that the A/D indicator can provide, we can clearly see some outstanding advantages as follows:
- Track overall cash flow: The A/D line gives us an overview of the cash flow in the market over a certain period of time.
- Identify buying and selling pressure in the market: This information is useful because it allows traders to make decisions based on whether the market is in an accumulation (buying) or distribution (selling) phase during that period.
- Trend detection and confirmation: The A/D indicator is a great tool for identifying trends and confirming the strength and sustainability of a recent price move.
- Detecting divergence between price and volume: The Accumulation/Distribution line also shows when price and volume are not in agreement with each other, which can be a sign that the market is about to reverse.
Disadvantages of the Accumulation/Distribution Line
However, when trading based on the A/D indicator, there are also some limitations to keep in mind:
- Does not reflect price gaps: This is the biggest limitation of the A/D Line. Since the formula only considers the price range within a single session, it completely ignores large price gaps that occur between sessions. For example, a stock might open with a strong gap up but trade within a narrow range throughout the session. In such cases, the A/D Line may fail to accurately reflect the strength of the buying pressure.
- A lagging indicator: Like most other technical indicators, the A/D Line is calculated based on past price and volume data. Therefore, it reacts only after price movements have already occurred, making it a tool for confirmation rather than for predicting future trends.
- May generate false signals: In sideways or low-volatility markets, the A/D Line may move without a clear direction and produce false divergence signals, making interpretation more challenging.
- Does not provide price targets: While the A/D indicator helps identify trends and potential reversals, it does not indicate where the price might move next. Traders need to combine it with other tools such as Fibonacci retracement or support/resistance levels to determine price targets.
Common mistakes to avoid when using the Accumulation/Distribution Line
Common mistakes when using the accumulation/distribution indicator comprise:
- Depend only on the A/D indicator without verifying signals with other technical tools.
- Not considering the market context, like earring announcements, can affect the price.
- Complex analysis by using numerous indicators leads to confusion.
- Ignoring price gaps.
- Utilizing it alone for managing risk results in bad trade timing.
Final thoughts
The Accumulation/Distribution Line is a useful technical analysis tool that helps investors assess cash flow and market trends. By understanding how this indicator works and how to apply it, you can make more accurate trading decisions and effectively seize investment opportunities. However, to achieve optimal results, traders should combine the A/D line with other analytical tools to increase reliability and limit risk. Wishing all traders successful trading!
See more: