

Indicator combination to help traders understand and control the market. Relying solely on a single indicator can lead to unconfirmed signals and increased risk. According to Tipstrade.org, combining multiple indicators will help reduce and increase the win rate, laying the foundation for the first orders. The following article will provide detailed instructions on how to combine safety and scientific indicators.
Why should you use indicator combination?
Before we get to the actual indicator combination, we first need to understand why it is important to combine them. You need to be aware that although each indicator has its own advantages and strengths, especially the popular and powerful ones, the reality is that they still have certain limitations.
There are a lot of advantages in indicator combination with each other. Below are the most important upsides that you can gain from using technical indicators in conjunction with each other.
Cross-validate signals
This is the most important benefit of indicator combination. They simply confirm the information from another indicator. So, once you use a certain technical indicator and have obtained some information from it, most experts recommend using another indicator just to confirm that information before taking action.
Filter out noise
When a result or information is gathered through the application of an indicator, it is often within a range, meaning it is less accurate than you think. The result is often obscured by the “noise” in the market. This is why sometimes when you act on data from an indicator, the market does not move in the direction you predicted. By using indicator combination, you can filter out the noise in the market and get clearer and more accurate results.
Adapt to market conditions
Another benefit of indicator combination for more accurate analysis is that it helps you better adapt to changing market conditions. There are many different factors that influence market movements, such as different trends, momentum, and volatility. By using multiple indicators, you can better prepare to handle and adapt to market conditions.
The golden rule of indicator combination
Here are some “golden” principles you need to follow to make the most of combining indicators:
- Choose appropriate additional indicators: Select indicators from different groups to avoid duplication.
- Limit the number of indicators: Usually, two to four indicators are sufficient. Too much will be confusing.
- Test and optimize: Always backtest with historical data. Refine your system on a demo account before risking real money.
- Emphasize confirmation: Let one indicator give the initial signal and other indicators confirm that signal.

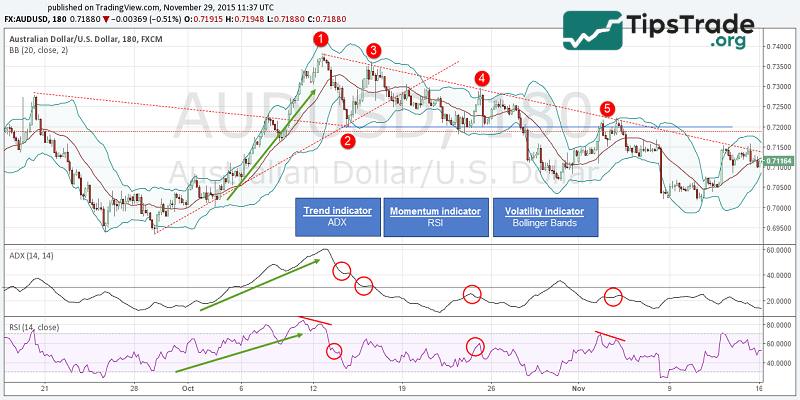
Some popular technical indicators
To illustrate how to combine indicators, let’s review some widely used indicators and their roles:
| Indicator | Type | Description |
| Moving Averages (MA) | Trend-following | Smooths price data to show direction. SMA and EMA are common forms. |
| Relative Strength Index (RSI) | Momentum | Measures the strength and speed of price moves on a 0-100 scale. Above 70 = overbought; below 30=oversold. |
| Bollinger Bands | Volatility | Bands around a moving average that widens out contracts based on market swings. |
| MACD (Moving Average Convergence Divergence) | Trend + Momentum | Tracks two EMAs, a signal line, and a histogram to show trend strength and direction shifts. |
Step-by-step guide to indicator combination
Below’s a practical guide to indicator combination for chart strategies:
Step 1 – Define your trading goal
This choice will guide your indicators setup. Accordingly, you should determine your style of day trading, swing trading, or long-term investing,…
| Trading Style | Preferred Indicators |
| Day Trading | Short-term EMAs (e.g., 10-period), fast oscillators |
| Swing Trading | 50-period SMA, RSI, MACD |
| Long-Term | 200-period MA, MACD, longer-term RSI |
Step 2 – Choose a primary indicator
After you’ve determined your trading goals, the next step is to choose a technical indicator that suits your trading strategy. Consider the following options:
- Select an indicator that aligns with your goal.
- For trend-based strategies, a Moving Average is a strong starting point.
- For momentum strategies, RSI or MACD may be ideal.
- This primary indicator will serve as the main signal generator in your analysis.

Step 3 – Add confirmatory indicators
Choose one or two indicators to confirm the primary signal.
- Moving Average-based trend strategy
- RSI to gauge momentum
- Bollinger Bands to assess volatility.
Step 4 – Set rules for entry and exit
Based on the combined signals, you should define clear rules. For example:
- Entry point: Buy when the 50-period EMA crosses above the 200-period EMA (trend signal), RSI is above 50 (momentum confirmation), and price is near the lower Bollinger Band (volatility support).
- Exit point: Sell when RSI reaches 70 (overbought) or the EMAs cross in the opposite direction.

Step 5 – Backtest and refine
Test your strategy’s performance by using historical data. Adjust parameters, such as indicator periods or thresholds, to optimize results.
Best effective indicator combination strategies
Let’s check some examples of 3 trading indicator combinations that may be applied in different approaches.
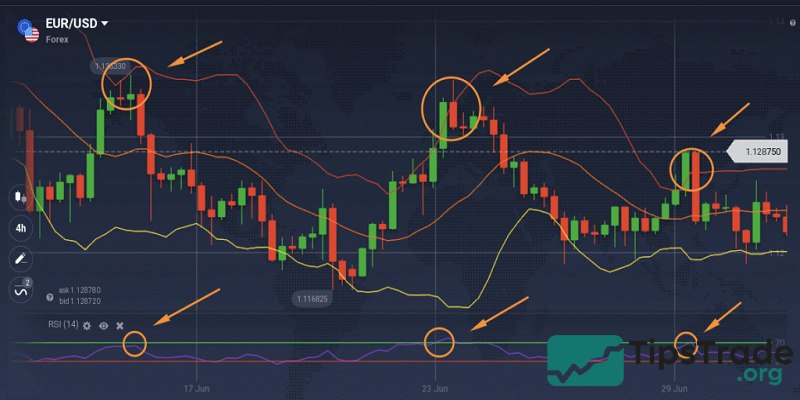
RSI + Bollinger Bands
- The RSI is an oscillator with standard levels of 70 and 30 displayed on the chart. It is a line that oscillates between values of 0 and 100. When the line approaches 70, the asset can be considered overbought. When it approaches 30, the asset can be considered oversold.
- Bollinger Bands (BB) consist of three lines: an exponential moving average (EMA) and two price channels above and below it. They show periods of high and low volatility of the asset. The further apart the bands are, the higher the volatility and the stronger the trend.
When the trading candle crosses the lower line of the Bollinger Band and the RSI line crosses the oversold level and starts to move up, this can be considered an opportunity for buying (long) positions. Conversely, when the chart crosses the upper band and the RSI is at the overbought level and starts to reverse downwards, this can be a potential opportunity to enter a sell (short) or exit position.
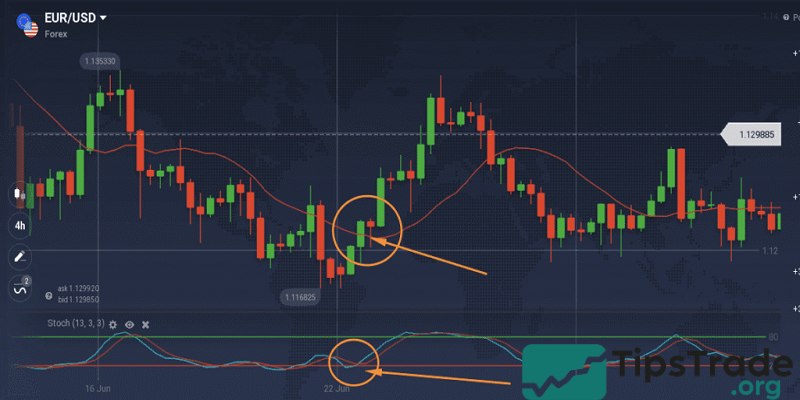
SMA + Stochastic
Another example of a popular trading indicator combination is the Simple Moving Average (SMA) and the Stochastic Oscillator.
- Simple moving average (SMA) is considered a fundamental tool in technical analysis. It helps smooth out price movements and reduce small, insignificant fluctuations, which can help you determine the true trend of the market.
- Stochastic Oscillator shows potential overbought and oversold levels. It is a leading indicator, which can signal a possible price reversal. It works well when combined with a lagging indicator like the SMA, which is calculated based on information from the asset’s past performance.
When the price crosses the SMA line from below and the Stochastic blue line crosses the red line, this could be a signal for an uptrend. Conversely, a potential signal for a downtrend appears when the market crosses the SMA line from above and the Stochastic shows the blue line crosses the red line.
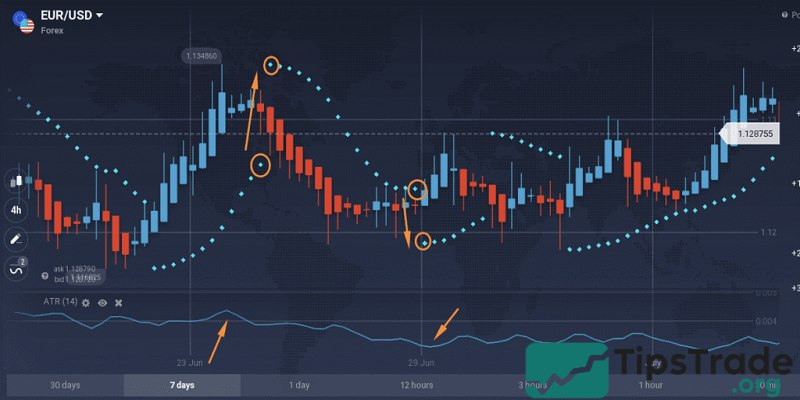
ATR + Parabolic SAR
- ATR is a volatility indicator, it does not show the direction of the trend, but measures the degree of market volatility. When the market is volatile, ATR can indicate potential trading opportunities. At the same time, ATR is also useful in determining appropriate Stop-Loss levels. In times of high volatility, greater risk can be managed with Stop-Loss.
- By combining the ATR indicator with the Parabolic SAR – a trend indicator – traders can find entry points in trending markets. It also helps in setting more precise Take-Profit and Stop-Loss levels.
When the Parabolic SAR dotted line is above the price chart, a short position can be considered. The potential entry point is marked when Parabolic moves from one position to another (for example, it moves from above the candle to below the candle).
Common mistakes to avoid when combining indicators
Traders often fall into these traps when combining indicators for chart strategies:
- Chart overload: Using too many indicators will create clutter and confusion, so keep the setup neat.
- Ignoring market conditions: Applying trend indicators in a ranging market or oscillators in a strong trending market will lead to poor results. Adjust the indicator combination to suit the market conditions.
- Ignore risk management: Even the best indicator combinations can fail. Use stop-loss and position size management to protect capital.
- Ignore backtesting: Trading without backtesting is like driving in the dark. Always validate your method before implementing it.
Final thoughts
Based on the entire analysis, it can be affirmed that indicator combination is the key method to help traders minimize risk and improve trading efficiency. Each indicator provides unique information, and when combined appropriately, they create a more comprehensive picture of trends, momentum, and price volatility. According to Tipstrade.org, a deep understanding of each indicator before combining them is a crucial step to avoid falling into the trap of conflicting signals or over-optimization. Wishing you successful trading!