
Cyclical trends describe the repeating patterns of expansion and contraction that shape economies, markets, industries, and consumer behavior. Even though technology changes fast, human psychology, supply–demand dynamics, credit cycles, and business behaviors consistently move in waves. Investors, business owners, and economists rely on cycle analysis to avoid avoidable risks and capture opportunities before the majority notices them. When someone recognizes the stage of the cycle, strategic decisions—like hiring, investing, saving, or scaling—become clearer and more rational. This article breaks down what cyclical trends are, how they function, how to measure them, and how they affect real economic outcomes. Visit tipstrade.org and check out the article below for further information
What Are Cyclical Trends?
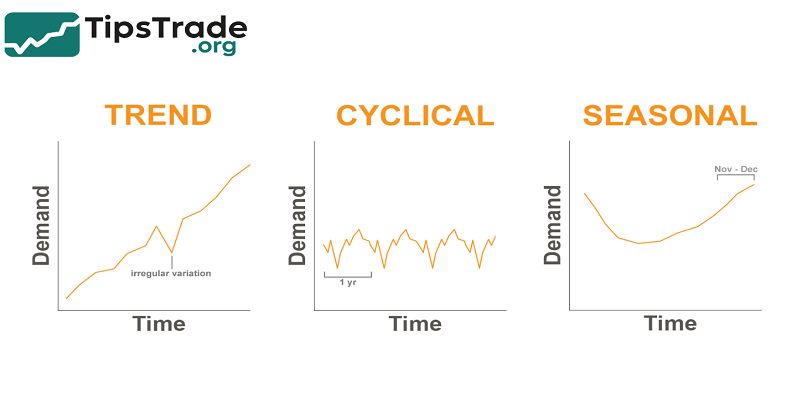
Definition and Core Characteristics
Cyclical trends are patterns that rise and fall in a repetitive manner. They can be seen in economic growth, consumer spending, stock prices, interest rates, real estate values, and even commodities.
Unlike secular trends—which move long-term and do not repeat—cyclical trends follow recognizable phases. For example, stock markets historically swing between bull markets and bear markets.
Economic activity rises when employment is high and businesses expand, then cools when demand decreases or credit tightens.
A defining trait is rhythm. While cycles are not perfectly timed, they tend to return: growth, peak, slowdown, recovery, and repeat. Economists from the National Bureau of Economic Research (NBER) track these cycles in the United States to document recessions and recoveries.
Businesses also plan hiring, expansion, and inventory based on cyclical expectations. Understanding cyclical trends helps avoid panic when downturns happen and prevents unrealistic optimism when everything is booming.
They remind us that neither prosperity nor hardship lasts forever.
The Science Behind Market Cycles
Market cycles do not happen by coincidence. They form through the interaction of monetary policy, investor psychology, supply chains, and global economic forces. When interest rates are low, people borrow and spend more.
Companies invest, hire workers, and produce goods, which pushes the economy upward. However, rapid expansion can cause inflation or over-leveraging.
When central banks raise rates or demand slows, businesses cut spending, triggering layoffs and reduced buying power.
Investor psychology plays a huge role. During market euphoria, people believe prices will always rise, leading to overvaluation. In downturns, fear takes over, causing sell-offs even in strong companies. According to IMF research, these sentiment shifts magnify booms and busts.
The famous “Greed–Fear Cycle” shows how emotional reactions create predictable waves in asset prices. Even without perfect timing, cycles can be measured by data: employment, production, retail sales, purchasing managers’ index (PMI), or yield curve signals.
In short, cycles are scientific, psychological, and mathematical all at once.
Types of Cyclical Trends in the Economy

Economic Cycles
The economic cycle traditionally moves through four major phases: Expansion, Peak, Contraction, and Trough. During Expansion, GDP rises, unemployment declines, wages improve, and businesses increase production.
A Peak is the moment growth becomes unsustainable—often caused by inflation or excessive debt. Contraction happens when demand drops, companies cut spending, and layoffs increase.
The Trough marks the bottom, where expectations reset and a new expansion begins.
The World Bank frequently reports that mature economies average a recession every 7–10 years, while emerging markets may fluctuate faster due to sensitive capital flows.
Examples include the dot-com crash (2000–2002), the Global Financial Crisis (2008–2009), and pandemic-induced decline (2020). Each time, the pattern follows familiar phases, even when causes differ. Businesses use economic cycles to plan hiring, pricing, and expansion, knowing downturns are not permanent.
Market Cycles in Stocks and Real Estate
Stock markets are one of the clearest representations of cyclical trends. A bull market appears when corporate profits rise, investor confidence is strong, and liquidity is high.
Prices climb gradually, then sharply toward the peak. When the market becomes overheated—often revealed by expensive valuations or excessive margin debt—it becomes vulnerable to correction or crash.
A bear market begins when prices fall 20% or more from recent highs.
Real estate also evolves in cycles. Demand for housing climbs when jobs are strong, interest rates are low, and consumer confidence grows. Prices rise, developers build aggressively, and credit becomes easy to obtain.
Eventually, oversupply or rising mortgage rates slow the market. The cooling phase reduces prices, and construction declines.
This cycle played out before the 2008 real estate crash, when loose lending caused a housing bubble. After the trough, buyers returned, and markets recovered, proving the repetitive nature of real estate cycles.
Industry and Sectoral Cycles
Not all industries react to cycles equally. Cyclical sectors—like automotive, airlines, tourism, construction, steel, and semiconductors—expand when consumer spending is high and decline when budgets shrink.
For example, when the economy weakens, car purchases or travel plans are delayed. Meanwhile, defensive or non-cyclical sectors like healthcare, utilities, and consumer staples remain stable because people still need essential services.
Commodity industries follow supply–demand cycles. Oil price spikes during geopolitical tensions or high energy consumption, then falls when global growth slows.
The International Energy Agency (IEA) notes that oil markets have moved in supercycles for decades.
Understanding which sectors are cyclical helps investors allocate money intelligently: entering cyclicals during early recovery and focusing on defensive stocks during slowdowns.
How to Identify and Analyze Cyclical Trends
Key Economic Indicators
Analysts use specific indicators to determine where the economy stands in the cycle. Common ones include:
| Indicator | Signals |
| GDP Growth | Rising = expansion; falling = contraction |
| Unemployment Rate | Low = peak; rising = slowdown |
| CPI / Inflation | High inflation = overheating |
| PMI Manufacturing | Above 50 = growth; below 50 = slowdown |
| Yield Curve | Inversion often predicts recession |
The yield curve inversion famously predicted several U.S. recessions, including 2001 and 2008. Similarly, the Consumer Confidence Index shows how optimistic people are about spending.
When confidence drops sharply, businesses expect weaker demand. By combining these indicators, researchers can fairly accurately estimate cycle stages.
Companies and investors rarely rely on a single metric—multiple confirmations strengthen reliability.
Technical and Sentiment Tools
Market analysts combine economic data with technical charts and sentiment readings. Price trends, moving averages, volume spikes, RSI oscillators, or MACD signals reveal momentum changes.
When a long uptrend loses steam or breaks support levels, it may signal the early stage of contraction.
Sentiment tools measure investor emotions. Surveys like AAII Sentiment Survey, CNN Fear & Greed Index, and VIX volatility index show whether the market is optimistic or scared. Historically, extreme greed appears near market peaks, while extreme fear often marks market bottoms.
For example, during March 2020’s crash, the Fear & Greed Index hit one of the lowest levels in decades, just before markets rebounded. These tools don’t predict exact timing, but they help investors avoid emotional decisions.
Common Mistakes When Reading Cycles
A frequent mistake is confusing a short-term correction with a full downturn. Financial markets often pull back 5–10% without signaling recession. Another mistake is relying on only one indicator—like unemployment or inflation—without viewing the big picture.
Media headlines can amplify fear or greed, leading to emotional trading.
Overconfidence during expansion causes businesses to over-borrow or overproduce. When contraction arrives, they face debt pressure and inventory problems. On the other hand, excessive pessimism during downturns may cause investors to sell quality assets at cheap prices.
Cycle analysis works best when decisions are data-driven, not emotional. Patience and diversification remain essential.
Applying Cyclical Trends in Investment and Business Strategy
Investing According to the Cycle
Investors who recognize cycle stages adjust asset allocation more intelligently. During early expansion, growth stocks, small caps, and cyclical sectors often outperform. As the market approaches a peak, defensive stocks (utilities, healthcare, consumer staples) tend to hold value.
When contraction hits, investors may shift to bonds, cash, or value stocks with strong balance sheets. Warren Buffett once noted that downturns reveal which companies are truly resilient.
Example allocation by cycle stage:
| Stage | Investment Focus |
| Expansion | Tech, retail, consumer discretionary |
| Peak | Utilities, healthcare, gold |
| Contraction | Bonds, cash, defensive stocks |
| Trough | Value stocks, real estate, index funds |
No system guarantees perfect timing, but cycle awareness reduces panic and helps long-term compounding.
Business Planning and Forecasting
Companies adjust hiring, production, staffing, and pricing depending on cycle conditions. When demand grows, businesses expand capacity and invest in marketing. Near the peak, they monitor inventory carefully to avoid oversupply.
During contraction, cost control becomes critical: scaling back hiring, renegotiating supplier contracts, or increasing operational efficiency.
For example, many retail companies reduce orders before economic slowdowns because consumers cut discretionary spending first. Airlines lower flight frequency when fuel costs rise or travel declines.
Businesses that understand cycles protect balance sheets and emerge stronger after recovery.
Risk Management During Cyclical Changes
Cycles naturally bring uncertainty. Risk management ensures survival through downturns. Investors diversify portfolios by sector, geography, and asset class.
Some use hedging strategies like gold, options, or low-volatility ETFs. Businesses build emergency cash reserves to cover payroll and operations during sales declines.
Interest rates also matter. When central banks tighten credit, companies with heavy debt face pressure.
Analysts from Harvard Business Review emphasize that firms with flexible capital structures outperform peers during recessions. Recognizing credit cycles helps avoid borrowing at the wrong time. Smart planning turns downturns from threats into opportunities.
How AI and Data Are Changing Cycle Detection
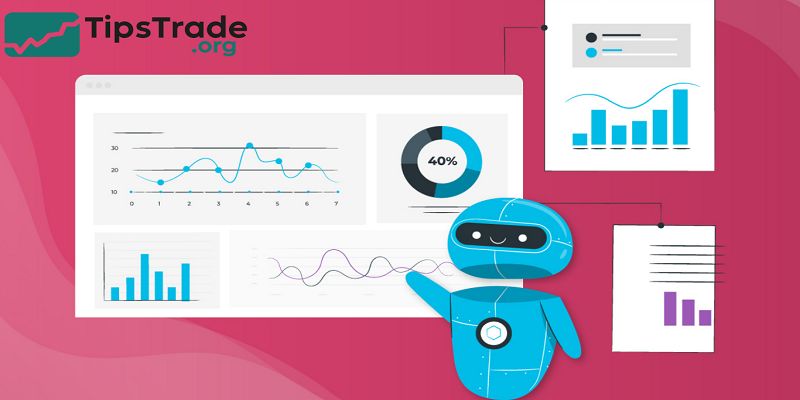
Machine Learning in Cycle Prediction
Artificial intelligence is transforming cycle analysis. Algorithms can analyze millions of data points—news sentiment, supply chain signals, interest rates, corporate earnings, and social media activity.
Machine learning models detect early signs of overheating or weakness faster than humans. Hedge funds already use AI-based prediction models to forecast volatility or recession risks.
For example, JPMorgan uses data analytics to track economic momentum and investor sentiment in real time.
Sentiment analysis software scans financial news to detect emotional language, helping traders understand crowd psychology. Although AI cannot prevent downturns, it improves decision-making under uncertainty.
Limitations of Predicting Cycles
Even with advanced analytics, cycle timing is never exact. Black swan events—such as pandemics, wars, or natural disasters—can disrupt predictions.
Economic data also lags, meaning policymakers only notice recession after it starts.
That is why experts emphasize managing risk rather than predicting exact turning points. Cycle knowledge is a tool, not a guarantee.
Long-term success comes from discipline, diversification, and patience.
Conclusion
Cyclical trends affect every economy, business, and investor. They shape expansion and contraction, opportunity and risk. Instead of fearing downturns, cycle knowledge transforms them into strategic advantages. No boom lasts forever, and no recession is permanent. Those who learn to interpret the rhythm of markets can survive shocks, invest wisely, and build long-term success.