
Trendlines are one of the most widely used tools in technical analysis because they visualize the direction of market movement, show momentum, and help traders identify potential trading opportunities. Whether a trader uses indicators, price action, or algorithmic systems, trendlines often become the foundation for understanding where price is heading. New traders usually learn trendlines as one of their first charting tools, while experienced traders continue using them as part of more advanced strategies. Visit tipstrade.org and check out the article below for further information
What Is a Trendline? Understanding the Basics
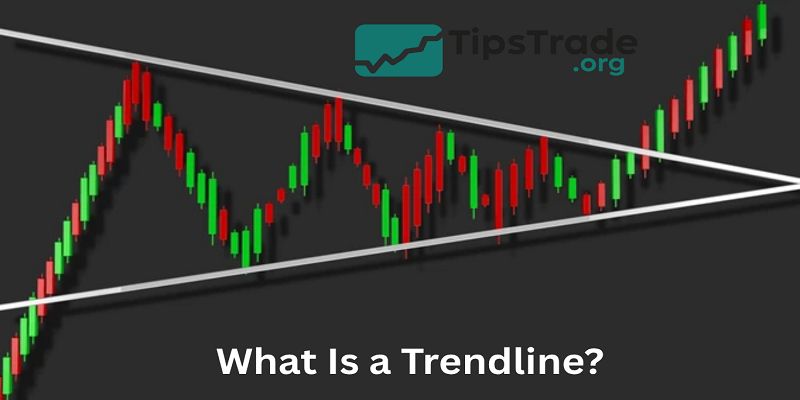
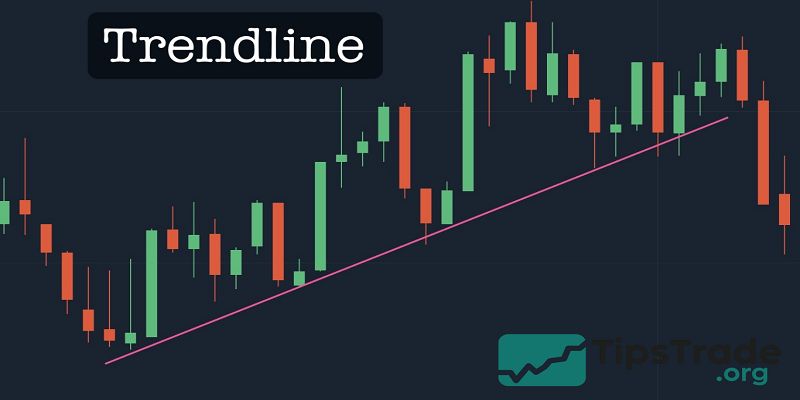
A trendline is a straight line drawn on a price chart that connects multiple highs or multiple lows. When the market is moving upward, a trendline usually sits below the price, acting as dynamic support.
When the market is moving downward, a trendline forms above price, working as resistance. Traders rely on trendlines because they simplify complex charts into something easy to read—direction.
If price consistently respects a trendline, the trend is considered strong. If it breaks, momentum may be shifting. Trendlines work across multiple asset classes including stocks, crypto, forex, commodities, and indices.
Even large institutional traders use trendlines to track price structure. According to experienced analysts on Investopedia and StockCharts, trendlines remain valuable because price tends to “respect structure.” When combined with market volume or candlestick patterns, trendlines provide clues about whether buyers or sellers are in control.
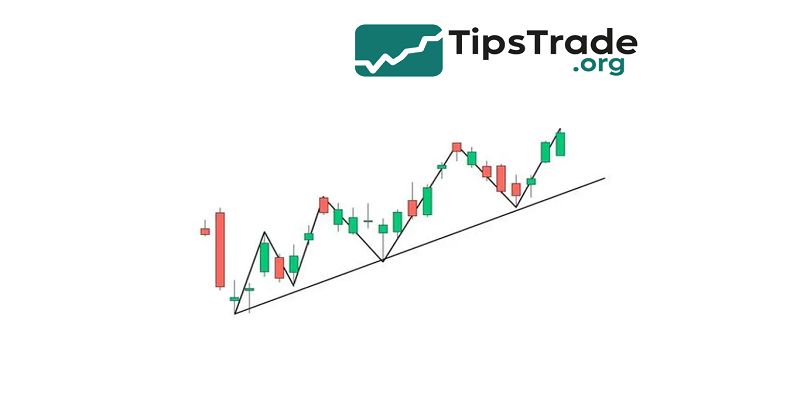
Uptrend Trendlines
An uptrend trendline connects two or more higher lows. As long as price stays above the line, buyers are in control.
Many traders use the phrase “buy the dip” when price pulls back into an uptrend line. For example, when Bitcoin rallied strongly in 2020–2021, price bounced off its daily trendline multiple times, showing strong bullish momentum.
An uptrend trendline can also act as dynamic support, meaning price may not be supported at a horizontal level but still reacts around the rising trendline.
Traders often combine uptrend lines with Fibonacci retracement, RSI divergence, or volume spikes to confirm whether the trend remains healthy.
When price closes below a strong trendline, it may signal weakening momentum or a new bearish phase. Still, not every break means reversal—sometimes price briefly dips below the trendline before moving back up, a situation known as a fake breakout.
Downtrend Trendlines
A downtrend trendline connects lower highs, showing that sellers maintain control. If price continues to reject the line, the market likely remains bearish.
Many traders wait for price to “retest” the downtrend trendline before entering a short position.
During the 2022 crypto and stock market declines, downtrend lines were widely used to identify low-risk areas to short or avoid buying prematurely. Downtrend trendlines often work as dynamic resistance, and when broken convincingly, they can signal a trend reversal.
Traders commonly watch for break-and-retest setups: price breaks above the trendline, pulls back to retest it, then continues higher. The retest provides a safer entry compared to chasing price after a breakout.
Combining a downtrend line with support levels, volume, or moving averages helps filter false signals.
How Trendlines Work in Financial Markets
Trendlines simplify price structure. When markets are trending, price makes a series of higher lows in an uptrend or lower highs in a downtrend. Trendlines visualize these patterns clearly.
Institutional traders, algorithmic systems, and charting tools all detect these structure points. Trendlines become even more powerful when they align with round numbers, previous support or resistance, or large volume levels.
A trendline break sometimes indicates stop-loss clusters being triggered or market participants shifting sentiment. In fast markets, like gold (XAU/USD) or cryptocurrency, trendline breaks often come with strong volatility.
That’s why experienced traders never use trendlines alone—they combine them with price action and risk management rules. The goal is not perfection but probability: identifying where price is more likely to react.
How to Draw Trendlines Correctly
Drawing trendlines looks easy but many traders do it incorrectly, making their analysis unreliable. A proper trendline requires discipline, a consistent method, and clear criteria.
Step 1 — Identify Two or More Valid Swing Points
- A line needs at least two points, but the more touches it has, the more significant it becomes. Traders typically wait for the third touch as confirmation.
- If price has only touched the line once, it’s not a trendline yet—just a random connection. Reliable swing points usually form as clear highs or lows, visible on the chart without zooming excessively.
- Most analysts prefer drawing trendlines using candle bodies rather than wicks, because bodies reflect the average market consensus.
- However, some traders use wicks for precision. Either is acceptable, as long as the method is consistent.
Step 2 — Use Higher Timeframes First
- Many beginners draw lines only on the 5-minute or 15-minute chart, but this often creates noise.
- Professional traders start with the daily or 4-hour timeframe and then refine entries on lower timeframes. Markets react more reliably to long-term structure.
- A trendline that holds on the daily chart has higher weight than one that exists only on the 1-minute timeframe.
- This is especially visible in forex and stocks, where institutional traders often care about higher timeframe structure. A simple rule: draw on a high timeframe, trade on a low timeframe.
Step 3 — Avoid Forcing the Trendline
- A common mistake is “forcing” the line to fit the price. A real trendline follows price—not the other way around.
- If you need to bend the rule, move the line, or ignore multiple highs or lows, the trendline may not exist.
- Reliable trendlines look clean: 2–4 clear touches, no random crosses, no forcing. When a trendline breaks cleanly, accept that the trend might be changing.
- Don’t redraw five variations to keep the bullish bias alive. Successful traders stay objective, adjusting their perspective when price invalidates a previous structure.
Step 4 — Volume and Confirmation
Trendline breaks without volume often produce fake signals. Many experienced traders look for:
- Volume increase during breakout
- Retest of the trendline
- Candlestick confirmation (engulfing, hammer, doji, pin-bar)
- Confluence with support/resistance
When volume increases during a breakout, it signals participation from bigger players. Without volume, price may simply be “wicking” above or below the line to remove stop-loss orders.
How to Trade Using Trendlines
Trendlines are not signals by themselves; they are tools for analysis. Traders combine them with entry patterns, risk management, and confluence. In real markets, the goal is not perfection—no trendline holds forever. Instead, trendlines help define structure and areas where probability favors a reaction.
Strategy 1 — Buying Pullbacks in an Uptrend
Many traders wait for price to retrace to the uptrend line, then look for confirmation:
- Bullish rejection candle
- Higher low formation
- Volume spike
For example, during strong stock trends like Tesla or NVIDIA’s rallies, pullbacks into the trendline repeatedly offered buying opportunities. A trader might place a stop-loss below the trendline and target prior swing highs.
Buying near a trendline often improves risk-to-reward compared to chasing breakouts.
Strategy 2 — Selling Rallies in a Downtrend
- In a bearish market, price often bounces into the downtrend line and rejects. Traders enter short positions after confirmation candles or bearish structure.
- This strategy worked repeatedly in declining markets such as Bitcoin during 2022.
- When price reached the downtrend line and rejected, sellers stepped back in.
- Trendlines alone don’t make the decision—confirmation matters. Some traders add RSI, MACD, or moving averages to avoid entering too early.
Strategy 3 — Break and Retest
- A break-and-retest setup is popular because it avoids the risk of entering too early.
- When price breaks a trendline, traders wait for price to come back and retest the line.
- If price respects the trendline from the opposite side, it confirms a shift in market structure.
- For example, if a downtrend line breaks and price retests it as support, the trend may be reversing to bullish. Break-and-retest can be applied in forex, crypto, stocks, and even commodities.
- It is widely referenced across professional charting courses because it filters weak breakouts.
Trendlines Combined With Support and Resistance
Trendlines become significantly stronger when they align with horizontal support or resistance. When both levels meet at the same area, traders call it “confluence.” Markets tend to respect confluence zones because multiple types of traders watch the same price area.
For instance, if an uptrend line meets a horizontal support around a round number like $50 or $100, price often reacts strongly. Adding volume analysis helps determine whether price is likely to break or hold.
When trendlines and horizontal levels disagree, horizontal levels usually carry more power because major orders often rest at fixed price points. Still, trendlines help see direction and momentum more clearly.
Trendlines in Different Markets
Trendlines behave differently in various asset classes. In forex, where liquidity is high, trendlines are often clean and predictable. In crypto, volatility can create false breaks. Stocks sometimes respect trendlines around earnings dates or macroeconomic news.
For commodities, trendlines often correlate with fundamentals like oil supply or gold demand. Professional traders study how each market reacts historically. But in every asset class, the core principle remains the same: trendlines help simplify structure and identify who controls the market—buyers or sellers.
Common Mistakes When Using Trendlines

Even though trendlines are simple, many traders use them incorrectly. These mistakes reduce accuracy and lead to emotional decisions.
Common errors:
- Forcing the line to fit price
- Drawing trendlines only on tiny timeframes
- Entering trades without confirmation
- Assuming every break equals reversal
- Ignoring volume
- Using only two touches and calling it valid
Many beginners adjust the trendline every time price touches it incorrectly, which indicates the line was never valid.
Others trade breakout candles too early without waiting for a close. A clean breakout usually closes beyond the line, not just a temporary wick. Learning to stay objective solves most of these issues.
Pros and Cons of Trendlines
| Aspect | Advantage | Limitation |
| Visual clarity | Easy to read market structure | Subjective if drawn incorrectly |
| Works in all markets | Forex, stocks, crypto, commodities | High volatility can cause fake breaks |
| Helps timing entries | Buy pullbacks, sell rallies | Not a standalone system |
| Identifies reversals | Break-and-retest signals | Must combine with confirmation |
Trendlines offer a strong blend of simplicity and effectiveness. However, they require discipline and context. Some traders treat trendlines as absolute indicators and ignore confirmation. This leads to false confidence. When applied properly, trendlines help traders make more structured and less emotional decisions.
Are Trendlines Reliable? What Research Suggests
According to technical analysis studies referenced by Investor Place and Stock Charts, trendlines work best when combined with volume or support-resistance. Research on market behavior shows that price moves in waves, and trendlines visualize those waves.
Although no indicator guarantees accuracy, trendlines help track momentum and market psychology. Professional trading firms often write algorithms that detect trendline structure to identify breakouts or breakdowns.
That explains why markets often react strongly at trendline levels—large orders cluster there.
Even traders who focus on fundamentals use trendlines to time entries. For example, Warren Buffett rarely buys at tops. If a fundamentally strong stock pulls back to a long-term trendline, value investors may enter.
This combination of price structure plus fundamentals adds weight to trendlines as a widely respected tool.
Conclusion
Trendline is an essential tool in technical analysis that visually represents the direction and strength of a price trend. Trendlines help traders identify market trends, support and resistance levels, and potential trend reversals. Understanding and effectively using trendlines allows traders to make more informed decisions regarding entry and exit points. Therefore, trendlines remain a fundamental component of analyzing market behavior and forecasting future price movements. This makes trendlines indispensable for traders aiming to navigate financial markets with precision and confidence.