
Downtrend represents a sustained period during which the price of an asset consistently falls over time. This trend reflects increasing selling pressure and bearish sentiment among traders and investors. Understanding how to recognize a downtrend early is essential for managing risk and making informed decisions in declining markets. Visit tipstrade.org and check out the article below for further information
What Is a Downtrend?
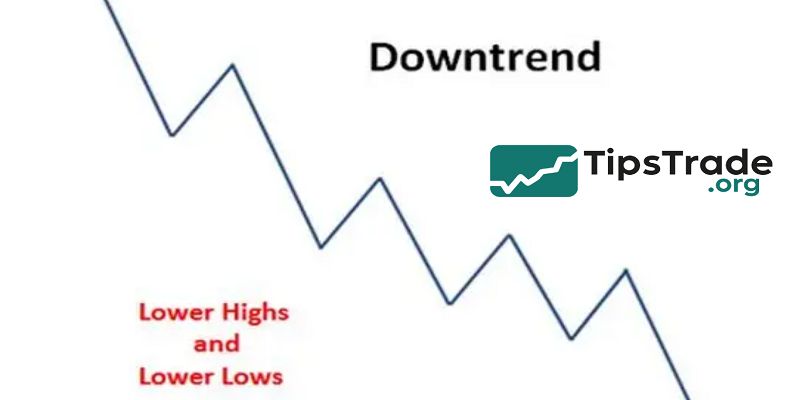
A downtrend is a consistent decline in the price of an asset over time, characterized by lower highs and lower lows. It reflects a bearish market sentiment where sellers remain in control, supply exceeds demand, and investors expect future losses.
Downtrends appear across stocks, crypto, forex, commodities, and even economic indicators like GDP or consumer spending. Traders usually identify a downtrend using price action, chart patterns, trendlines, and technical indicators such as EMA, RSI, or MACD.
Recognizing a downtrend early helps traders manage risk, avoid buying at the wrong time, and look for short-selling opportunities. Many beginners mistake temporary pullbacks for reversals, but a true downtrend continues making lower price floors.
Understanding how it forms, how long it might last, and when it could reverse is essential for successful trading.
How a Downtrend Works
A downtrend begins when selling pressure overtakes buying interest. This causes price to break previous support levels and create new lows. Institutions, retail traders, economic news, and market psychology all contribute to bearish momentum.
News like recession fears, poor earnings reports, or rising interest rates can accelerate a downtrend. According to market studies from Nasdaq and CFA Institute, emotional trading during panic often deepens bearish moves—investors rush to exit, creating snowball losses.
In financial markets, downtrends don’t move in a straight line. Prices may bounce temporarily (called pullbacks), but the overall direction remains downward. A trend is considered active as long as lower highs and lower lows remain intact. For long-term investors, downtrends signal caution.
For short-term traders, they present an opportunity to short-sell or wait for a strong reversal before entering new long positions.
Key Characteristics of a Downtrend
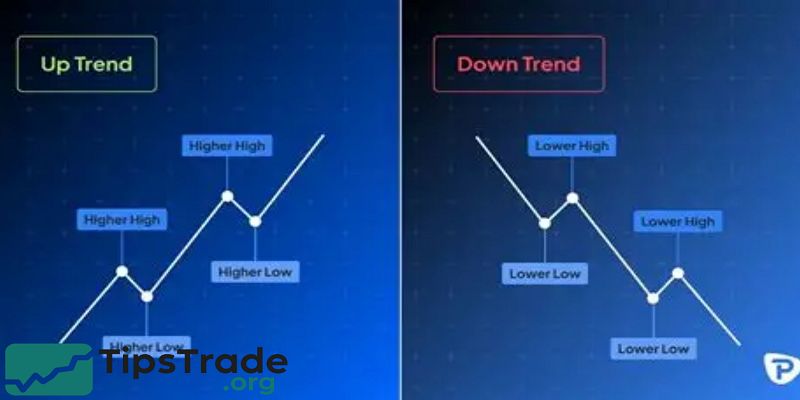
A valid downtrend contains three major elements:
| Indicator | What It Means |
| Lower Highs | Buyers are weaker each time price bounces |
| Lower Lows | Sellers push price to new bottoms |
| Falling Volume | Confirms decreasing investor confidence |
Other signs include negative technical indicators, bearish candlestick patterns, and supports consistently breaking.
Technical analysts often draw descending trendlines to visualize the slope of price decline. If price remains below the trendline, the trend is strong.
Once price breaks above it with high volume, it may signal a reversal. Downtrends can last days, weeks, months, or even years depending on the economy.
For example, Bitcoin’s multi-month 2022 downtrend wiped out more than 70% of market cap due to global inflation and interest rate hikes, proving how macroeconomic forces can dominate price direction.
Popular Technical Indicators to Confirm a Downtrend
Moving Averages (MA & EMA)
- Moving averages smooth price data to show overall direction. In a downtrend, price stays below major MAs such as the 50-day or 200-day. When the 50-day crosses below the 200-day, it forms the “death cross,” a famous bearish signal used by stock and crypto traders.
- Many trading platforms—including TradingView and MetaTrader—recommend using EMAs because they react faster to price changes.
- A wide gap between price and MA indicates strong downside momentum.
RSI
- The Relative Strength Index measures momentum. When RSI stays below 50 or moves near oversold levels (30 or lower), it confirms bearish strength.
- However, oversold does not mean reversal—during major downtrends, RSI can stay low for weeks.
MACD
- The MACD helps identify momentum shifts using moving averages. When the MACD line crosses below the signal line and stays negative, it confirms sellers are in control.
- Analysts also check histogram bars—bigger negative bars mean stronger bearish pressure.
Trading Strategies During a Downtrend
Investors who ignore trend direction face large losses. Professional traders often:
- Avoid buying aggressively
- Use stop-loss orders
- Trade only when signals are clear
- Look for short-selling opportunities
- Wait for confirmation before entering a reversal
Short-selling is the most common bearish strategy—traders borrow an asset, sell it high, and buy it back lower for profit. Swing traders use trendline bounces or failed breakouts to enter short positions.
Day traders often combine moving averages with volume indicators to catch short-term dips. Conservative investors stay in cash or switch to defensive assets like gold or bonds.
According to data from Bloomberg, portfolios using risk-management rules—stop loss and position sizing—survive downtrends far better than emotional traders.
When Does a Downtrend End? Signs of Reversal
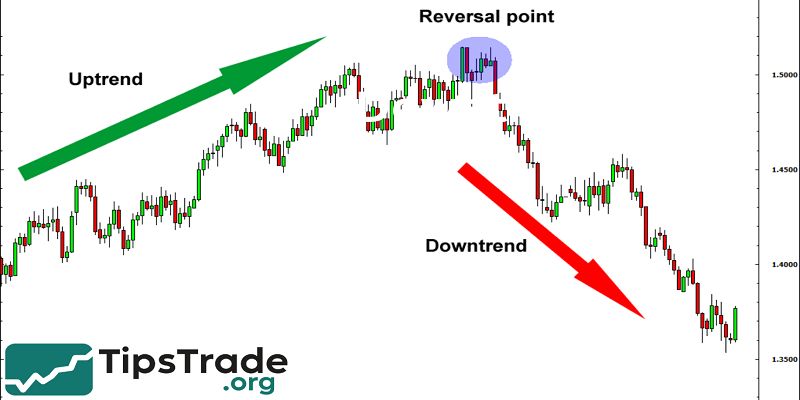
A downtrend may end when buyers regain strength. Traders usually look for:
- Price breaking above a trendline
- Higher lows forming
- Rising trading volume
- Bullish candlestick patterns
- Positive macroeconomic news
A false breakout happens when price rises temporarily but falls again. That’s why volume confirmation is important.
Research published by MIT observes that reversal signals are most reliable when technical indicators align with fundamental improvements such as stronger earnings or policy changes.
Reversals may lead to accumulation phases, where smart money buys quietly before a new uptrend begins.
Conclusion
Downtrend signals caution for traders and investors as asset prices continue to decline, often indicating weakening market conditions. By identifying downtrends promptly, market participants can adopt protective strategies and minimize potential losses during bearish phases.