
Uptrend represents a sustained period during which the price of an asset consistently moves higher, creating optimism among traders and investors. In financial markets, identifying an uptrend is crucial because it signals a favorable environment for buying opportunities and profit potential. Understanding the characteristics and signals of an uptrend allows investors to align their strategies with prevailing market momentum and maximize returns. Visit tipstrade.org and check out the article below for further information
What Is an Uptrend? Clear Definition for Beginners
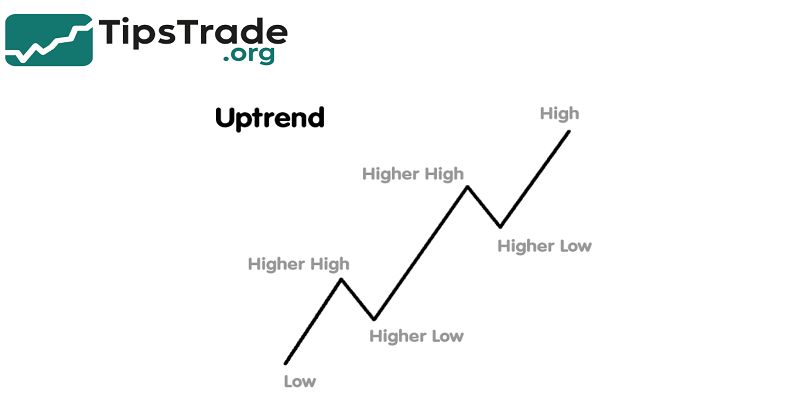
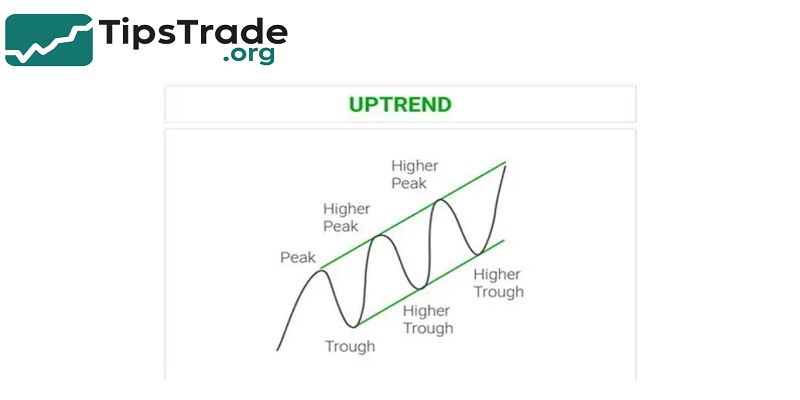
An uptrend is a market condition where price consistently moves upward over a specific period. It happens when buyers are more aggressive than sellers, pushing price to form a staircase structure: each peak is higher than the previous peak, and each pullback stops above the previous low.
This structure is known as Higher Highs (HH) and Higher Lows (HL). The concept exists in every liquid market — from Bitcoin to gold, from USD pairs in forex to tech stocks like Apple and Tesla.
Uptrends can be fast and explosive during strong economic optimism, or slow and steady when institutional investors gradually accumulate.
Traders like uptrends because they offer high-probability buying opportunities with clear stop-loss placements below previous lows. Even Warren Buffett famously invests in stocks that maintain long-term uptrends supported by strong fundamentals.
Meanwhile, technical traders focus more on chart patterns, volume, moving averages, and trendlines. While every uptrend eventually ends, understanding market structure helps traders spot early warning signs, manage risk, and take profit safely without guessing.
A Simple Example of an Uptrend on the Chart
Imagine Bitcoin trading at $40,000. Buyers push the price to $44,000 (Higher High). Price drops slightly to $42,000 (Higher Low), then moves up again to $47,000.
A new Higher High confirms the uptrend. Even though the price pulls back occasionally, the general direction remains upward.
Traders visually draw a diagonal line under price swings to form a trendline. As long as price stays above that line and keeps forming HH and HL, the market remains in an uptrend.
When price closes below the trendline or breaks a major Higher Low, the trend may be weakening. Many beginners assume a small drop means the trend is finished, but in reality, healthy uptrends always include pullbacks — they allow smart money to buy cheaper.
How to Identify an Uptrend on the Chart
Spotting a real uptrend is not only about price moving up. Professional traders confirm the trend using multiple technical tools to avoid false signals. Below are the most common methods.
Identifying Uptrend Using Trendlines
- Trendlines are one of the simplest and most accurate tools for confirming an uptrend. A trendline is drawn by connecting two or more Higher Lows.
- If the line is rising consistently and price keeps touching or staying above it, buyers are in control.
- Trendlines help traders visualize momentum, spot healthy corrections, and time their entries. Many traders buy when price moves close to the trendline because they expect support.
- However, not every trendline break means the trend has ended. False breaks often happen during high volatility or news releases.
- A true trendline break usually comes with a strong candle close below the line, increased volume, or a break of market structure.
- This is why traders combine trendlines with other signals such as moving averages or RSI divergence.
- When multiple signals agree, confirmation is stronger and risk becomes lower.
Identifying Uptrend Using Moving Averages
Moving Averages (MA) such as MA20, MA50, and MA200 act like dynamic support in an uptrend. When price stays above these lines and the MA is sloping upward, the trend is strong. Many professional traders use the “stacking” rule:
- Price above MA20 → short-term uptrend
- Price above MA50 → medium-term uptrend
- Price above MA200 → long-term bullish market
When faster MAs cross above slower ones (for example, MA50 crosses above MA200), the signal is called a Golden Cross, a sign of strong bullish momentum. Backtests published on Investopedia and TradingView show that markets respecting MA50 or MA200 often stay in uptrends for weeks or months.
Traders normally enter after small pullbacks near MA20 or MA50 and place a stop-loss below the nearest Higher Low. The advantage of moving averages is that they reduce emotional trading and keep traders aligned with the primary direction.
Identifying Uptrend Using Volume
- Volume measures the number of transactions happening in the market. In a strong uptrend, price increases with rising volume because more buyers participate.
- If price goes up but volume keeps dropping, it may be a sign of weakening momentum.
- High volume on breakout candles — especially when price closes above resistance — indicates aggressive buying.
- Many institutions and large funds leave “footprints” through volume spikes, which retail traders can see on the chart.
- During retracements, volume typically decreases. This is normal because fewer traders are selling.
- When volume rises again during price recovery, the trend is likely to continue. Platforms like Binance, Coinbase, and NYSE use volume analysis to detect accumulation periods, where professionals quietly buy before a strong rally.
- Volume is not used alone, but when combined with trendlines or moving averages, confirmation becomes highly reliable.
Indicators That Help Confirm an Uptrend: RSI, MACD, ATR
- RSI (Relative Strength Index) remains above 50 in most uptrends. When RSI creates Higher Lows the same way price does, momentum supports the trend.
- MACD shows positive histogram bars and signal line crossing above the zero level — a common setup used by swing traders.
- ATR measures volatility; rising ATR means buyers are in control with strong price expansion.
- None of these indicators guarantee profit, but professional traders treat them like “evidence.” When price action, trendline, MA, and indicators all point upward, the probability of continuation becomes high.
How to Trade in an Uptrend
Trading an uptrend is not only about buying anywhere. Successful traders use rules, timing, and risk management. Below are the most used strategies on real charts.
Buying the Dip (Buy-the-Dip Strategy)
- Buying the dip means entering when price temporarily pulls back during an uptrend. Instead of chasing the market at the top, traders wait for price to return to a support zone, trendline, or moving average.
- This strategy helps reduce FOMO and offers a safer stop-loss level below previous lows.
- For example, traders often wait until price touches MA20 or MA50, then look for bullish candlestick patterns such as a hammer, engulfing candle, or morning star.
- Research from TradingView backtests shows that trend-following strategies like buy-the-dip outperform random entries, especially when volume supports the continuation.
- Traders also set clear take-profit targets at the next Higher High or near resistance zones. The key to success is discipline — buying every minor dip is not necessary.
- A structured approach leads to better outcomes than emotional trading.
Trading Breakouts in an Uptrend
- Breakout trading means entering when price breaks above resistance or creates a new Higher High.
- Breakouts with strong volume show that buyers are taking control. Many traders place stop orders above resistance, letting the market trigger their entry automatically.
- Platforms like MetaTrader and Bybit show millions of breakout trades daily because this method works well on stocks, crypto, and forex.
However, fake breakouts exist. Price sometimes spikes above resistance, traps buyers, then falls back. To avoid this, traders use confirmation:
- Volume expansion
- Strong candle close above resistance
- Retest of the breakout level (old resistance becomes new support)
Breakout trading is useful when the market is moving fast and pullbacks are shallow. Combining breakout and dip-buying gives traders multiple ways to ride the trend.
Dollar-Cost Averaging (DCA) for Long-Term Uptrends
- Dollar-Cost Averaging is popular among long-term stock and crypto investors. Instead of putting all capital in one trade, they divide investment into smaller recurring purchases — weekly or monthly.
- This strategy reduces emotional pressure and benefits from long-term uptrends. If the price rises over months or years, DCA builds a strong average entry.
- It is used by large investors and recommended by many financial institutions because it avoids trying to “time the market.”
For example, an investor buying Bitcoin monthly since 2020 would have accumulated at many price levels but still profited because the long-term uptrend continued. DCA works best with assets backed by fundamentals, not hype.
Strong Uptrend vs Weak Uptrend: Key Differences
Not every uptrend is equally powerful. Some are short and fragile, while others last for years.
| Feature | Strong Uptrend | Weak Uptrend |
| Higher Highs | Clear and wide | Small and uncertain |
| Volume | Expanding on rallies | Decreasing over time |
| Pullbacks | Shallow and fast recovery | Deep and frequent |
| Moving Averages | Price stays above MA20/50 | Price constantly touches MA |
| Market Sentiment | Optimistic | Mixed or fearful |
A strong uptrend attracts institutional money, major news, and positive fundamentals. A weak uptrend often comes from retail speculation and can break easily under pressure. Traders prefer strong trends because they offer better reward-to-risk ratios and lower chance of reversal.
Six Signs an Uptrend Is Losing Strength
Even the best trend will not last forever. Here are common warning signals traders watch:
- Falling volume even as price climbs
- New highs are lower than previous highs
- Price breaks below MA20 or MA50 with strong volume
- RSI or MACD divergence (price goes up but indicator goes down)
- Trendline break with strong candle close
- Negative macro news or fundamental shift
When multiple signs appear, traders tighten stop-loss or take partial profit. Smart traders protect gains instead of hoping the trend comes back.
Common Mistakes Beginners Make in Uptrends

- Buying the top because of FOMO
- No stop-loss, leading to large losses during pullbacks
- Entering too often, not waiting for confirmation
- Ignoring volume
- Confusing a short pump with a real uptrend
- Sale too early due to fear
A simple trading plan prevents these mistakes. Professionals use rules, not emotions.
Uptrend in Forex, Crypto, and Stocks — What’s Different?
- Forex: Uptrends depend on central bank policy, interest rates, and economic data. Currency pairs trend smoothly when fundamentals are strong.
- Crypto: Uptrends are more volatile. Market sentiment, news, and whale activity cause sudden spikes and deep corrections.
- Stocks: Uptrends are backed by earnings growth, company performance, and industry demand. Tech stocks like NVIDIA or Apple have shown long multi-year uptrends supported by fundamentals.
While price patterns look similar, understanding the asset class improves decision-making.
Backtesting and Proving an Uptrend with Data
Backtesting means testing a strategy on historical charts before trading real money. Traders use platforms like TradingView to check:
- How long trends usually last
- Best entry zones
- Average profit targets
- Maximum drawdown
- Data-driven strategies reduce emotions and improve consistency.
Conclusion
Uptrend provides traders with a clear signal of market strength, allowing them to plan investments accordingly. Staying aligned with an uptrend can increase the chances of success, as it often leads to favorable returns during bullish phases.