
The ROC indicator is a fairly good market signal forecasting tool due to the movement of the rate of change. This rate is calculated based on the change in price candles over a defined period. So, what is the ROC indicator? How should investors use this indicator effectively in trading? The following article from Tipstrade.org will provide you with a detailed answer!
What is the ROC indicator?
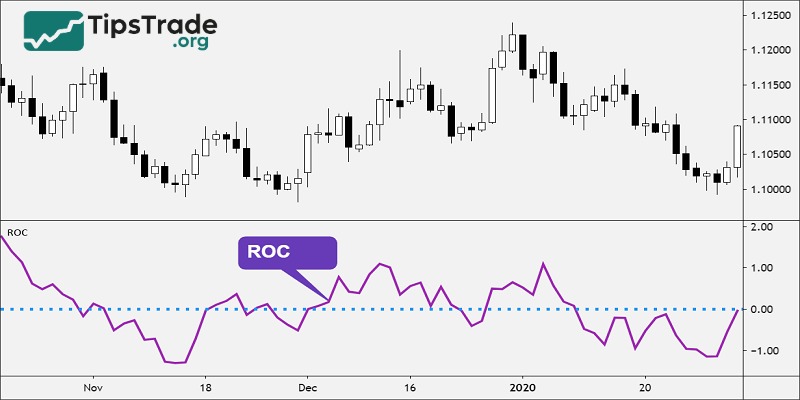
The ROC indicator, also known as The Rate of Change, is a price-based tool that measures the rate of change in prices over two different periods of time.
This indicator is also calculated by comparing the price change over that period.
The signals that investors can encounter in this indicator are: centerline crossover (0 point), divergence and overbought/sold. When the ROC indicator is described as a percentage, this tool will be most effective; thereby giving momentum signals and identifying overbought and oversold zones for investors.
>>See more:
- Moving Averages and how does it use to find the trend
- What is the MACD Indicator and How to Use It?
- Understanding RSI indicator: A Beginner’s Guide
- A Complete Guide to Using the Stochastic Indicator from A–Z for Beginners
Formula for calculating the ROC indicator
The formula for calculating the ROC indicator is as follows:
ROC = [(Current Price – Price “n” Periods Ago) / Price “n” Periods Ago] * 100
In this formula, “n” represents the number of periods used in the calculation. The resulting value is expressed as a percentage, which oscillates above and below the zero line as the ROC shifts from positive to negative.
How does the ROC indicator work?
The ROC indicator tracks changes in the market, through which the indicator tends to increase or decrease or remains sideways.
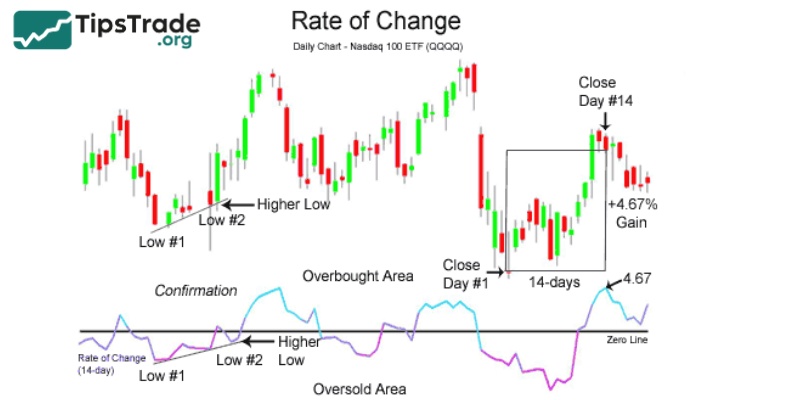
This indicator tracks the closing price of two periods. The typical tracking period is 12 days. The indicator takes the closing price of the previous 12 sessions and subtracts it from the current session’s closing price.
Once determined, the indicator will give the difference of the sessions through the rate of change. This rate is usually calculated as a percentage (%). A rate below 0 will be a pretty bad result and vice versa if it is above 0 it is good.
What does the ROC indicator tell traders?
The main purpose of the ROC indicator is to help investors identify the overall trend and assess market momentum as follows:
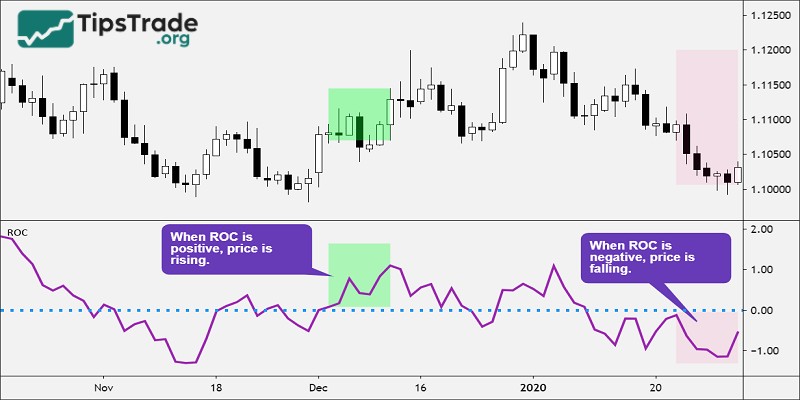
- Bullish signal: When the ROC value rises, it typically indicates increasing momentum and suggests that the asset may be in a strong uptrend. Investors can use this signal to identify potential buying opportunities.
- Bearish signal: Conversely, when the ROC value declines, it signals decreasing momentum and suggests that the asset may be starting a correction or entering a downtrend. In this case, investors may consider closing positions or reducing their investment exposure.
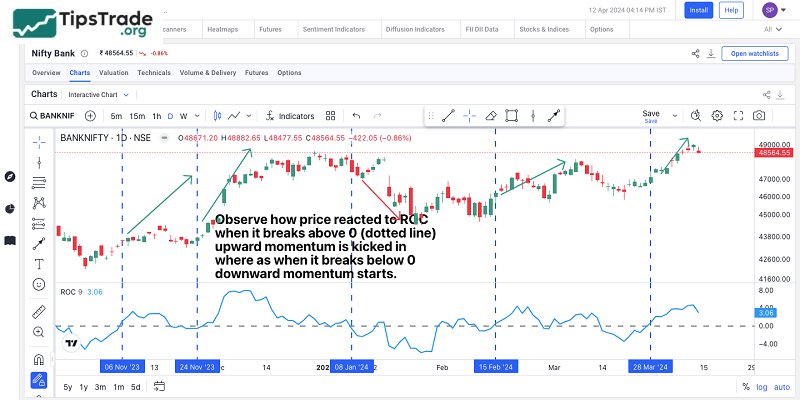
- Positive and negative levels analysis: When the ROC remains above zero, it indicates that the asset tends to continue rising in price. On the other hand, if the ROC stays below zero, it may signal that the asset is struggling to gain upward momentum.
Using the ROC indicator in trading
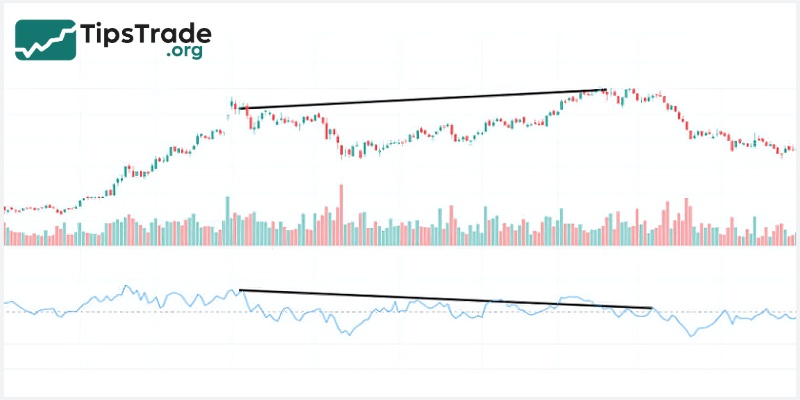
Divergence
Divergence occurs when the price candles and the ROC indicator move in opposite directions. Divergence can be categorized into two main types:
- Bullish divergence: This happens when the price candles show a downward trend while the ROC indicator is trending upward. This suggests a potential reversal from a downtrend to an uptrend, as the momentum indicator signals increasing strength.
- Bearish divergence: This occurs when the price candles are trending upward while the ROC indicator is trending downward. In this case, there is a high probability that the price may reverse and start to decline.
Analyzing divergence helps investors identify potential reversal points on the chart, allowing them to make more informed trading decisions.
Identifying overbought/oversold levels
The ROC indicator does not have fixed boundaries, which means it can show negative values during strong bullish or bearish market phases. In such cases, ROC may present values beyond its typical range.
Overbought and oversold levels are identified based on the extreme high and low values of the ROC indicator. These are zones that investors can use to detect potential market reversal points and make appropriate trading decisions.
However, since ROC has no defined upper or lower limits, its overbought and oversold signals can be subjective and unreliable when used in isolation. Therefore, traders often combine ROC with other indicators, such as the Relative Strength Index (RSI), to gain a more comprehensive view and make more optimal trading decisions.
Early warning of trend changes using the ROC centerline crossover
When the Rate of Change indicator is above the centerline (zero line), it suggests that price candles may continue to rise. Conversely, when the indicator is below the centerline, prices are likely to continue their downward trend. When the ROC crosses below the centerline, it signals a potential shift from an uptrend to a downtrend; and when it crosses above, it indicates a possible reversal from a downtrend to an uptrend.
If the Rate of Change indicator stays above the centerline for an extended period, an upward crossover often signals that the market has likely formed a bottom. Investors may consider entering buy positions to capture profit during the recovery phase.
Confirming the continuation of a trend
The slope and values of the ROC indicator can help confirm the strength of a short-term trend. When the market experiences strong buying or selling pressure, the ROC slope will reach extreme levels, but only for a short period of time.
The market is likely to continue its current trend if the ROC slope remains at a “moderate” level, indicating that supply and demand are in balance and a reversal is less likely to occur. During this phase, investors may consider adding to their positions or reducing them to optimize profits and cut potential losses.
Pros and cons of the ROC indicator
Pros of the ROC indicator
The Rate of Change indicator has several important advantages when applied in technical trading analysis as follows:
- The ROC indicator typically works well in trending market conditions, helping to identify and confirm recent trends in asset prices up or down.
- ROC is a momentum-based indicator that provides important information about the strength of the recent trend. However, it is often used in conjunction with other indicators to get a better overall picture.
- The Rate of Change indicator is able to identify when the market is trending overbought or oversold, helping to define potential turning points.
- ROC is also a powerful technical tool for detecting divergence, which can help identify discrepancies between price action and the indicator.

Cons of the ROC indicator
Here are some disadvantages of the ROC indicator that investors need to note when applying in technical analysis of trading:
- The ROC indicator can give false or inaccurate signals in some cases. It is important to be cautious when using the ROC and not rely solely on it to make trading decisions.
- When the ROC maintains a value near the zero line for a significant period of time, a consolidation phase may occur, leading to a situation where one buys or sells too early in an attempt to keep up with the significant volatility of the underlying financial asset.
- The ROC indicator gives equal weight to recent prices and prices from selected periods. This may be disproportionate in cases where recent prices are more important.
Conclusion
The ROC indicator provides quite reliable trading signals for investors. One of the signals investors can rely on with this indicator is divergence and overbought/oversold zones. Besides, investors should combine other technical indicators for more informed decisions.
See more: