
In the world of trading, predicting the direction of price movement is extremely important. And the OBV indicator itself is one of the powerful tools that supports traders in this regard. By analyzing trading volume, OBV helps us better understand the dynamics of money flow in the market. In this article, Tipstrade.org will provide you with an overview of the OBV indicator, from its calculation formula to how to use this type of technical indicator effectively in trading. Check it out now!
What is the OBV indicator?
The OBV indicator (On Balance Volume) is a technical indicator developed by Joseph Granville. It measures trading volume and relates it to price volatility to predict price changes. OBV is a simple but effective indicator used by many traders to identify market trends and find reversal points.
History of the OBV indicator’s formation:
- Origin: The OBV indicator was developed by Joseph Granville, a renowned technical analyst, and was first introduced in his 1963 book, “New Key to Stock Market Profits.”
- Core idea: Granville believed that trading volume was the key factor, the main driver of financial markets. He believes that analyzing trading volume can help predict future price trends.
>>See more:
- Understanding RSI indicator: A Beginner’s Guide
- How to calculate and use the MFI indicator in technical analysis
- What is the ROC Indicator and How to Use It in Trading?
- What is the CCI indicator? Formula for calculating CCI in technical analysis
Formula for calculating OBV indicator
The formula for calculating OBV indicator depends on the trading volume and the closing price from the previous session. There are 3 rules for calculating OBV as follows:
If the closing price of the asset is higher than the previous day’s closing price:
OBV = Previous OBV + Current Day’s Volume
If the closing price of the asset is the same as the previous day’s closing price:
OBV = Previous OBV (+ 0)
If the closing price of the asset is lower than the previous day’s closing price:
OBV = Previous OBV – Current Day’s Volume
For example:
- Day 1: Close = $100, Volume = 1,000 → OBV = 1,000
- Day 2: Close = $102 (up), Volume = 1,500 → OBV = 2,500
- Day 3: Close = $101 (down), Volume = 1,200 → OBV = 1,300
How to use OBV indicator in trading
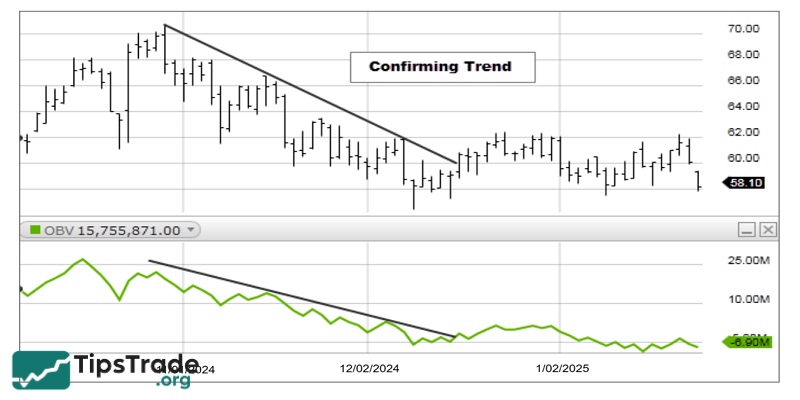
Follow and confirm trends
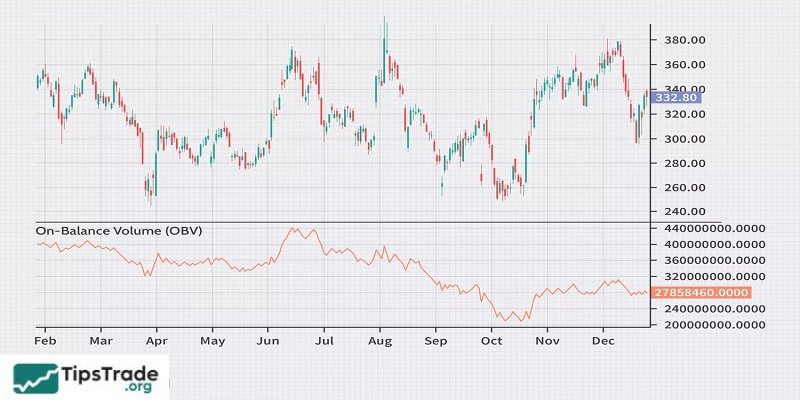
The OBV indicator (On Balance Volume) is a useful tool in technical analysis, helping traders identify market trends through trading volume. Rising OBV indicates strong buying pressure and a potential continuation of the uptrend. Conversely, a decreasing OBV indicates strong selling pressure and a potential continuation of the downtrend.
For example, if you see a stock’s OBV indicator consistently rising for several weeks, it’s a sign that the stock is in an uptrend and you might consider buying it.
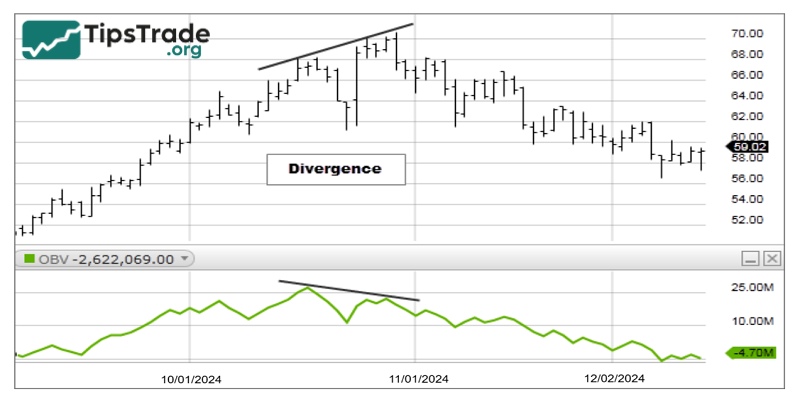
Find divergences
- Divergence between OBV and price: Reversal signal: Divergence occurs when price and OBV move in opposite directions. For example, if the stock price is rising but the OBV is not increasing or is even decreasing, this could be a sign that buying pressure is weakening and the uptrend may be nearing its end. Conversely, if the stock price declines but OBV doesn’t decrease or even increases, it could indicate weakening selling pressure and that the downtrend may be nearing its end.
- OBV breaks resistance/support levels: Confirmation of reversal: When OBV breaks through a significant resistance level, it can be a signal that a new uptrend is beginning. Conversely, when OBV breaks through a significant support level, it can signal the beginning of a new downtrend.
Combine with other indicators
- RSI (Relative Strength Index): The RSI is an indicator that measures price momentum. Combining OBV and RSI can help you confirm trends and find reversal points more effectively.
- MACD (Moving Average Convergence Divergence): MACD is an indicator that helps identify price trends and momentum. Combining OBV and MACD can help you make more accurate trading decisions.
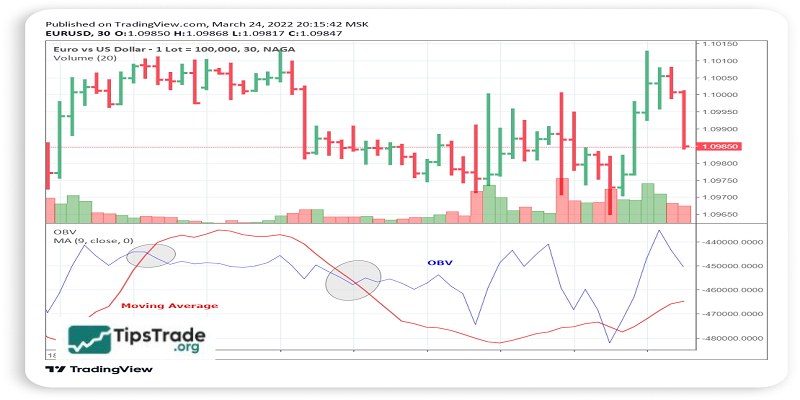
- Moving Average: A moving average is an indicator that helps smooth price data and identify trends. Combining OBV and moving averages can help you identify the long-term trend of the market.
Limitations of the OBV indicator to consider
A limitation of the OBV indicator is that it is a leading indicator, so it can only make predictions and provides little proof of what actually happened based on the signals it provides. Therefore, OBV tends to generate false signals. To balance this, lag indicators can be used for balancing. Add a moving average to the OBV to look for OBV breakouts; if the OBV indicator generates a simultaneous breakout, you can confirm a price breakout.
Another cautionary note when using OBV is that a sudden increase in volume on a single day can skew the indicator for an extended period. For example, an unexpected earnings announcement, being added to or removed from an index, or large-volume trades from institutions can cause a spike or sharp drop in indicators, but this volume surge may not be indicative of a trend.
Conclusion
In technical analysis, the OBV indicator (On Balance Volume) plays a crucial role in assessing price momentum through trading volume. By analyzing volume fluctuations, OBV can provide investors with valuable insights into market trends. However, to optimize effectiveness and minimize risk, it is essential to combine OBV with additional indicators such as RSI, MACD, or moving averages. Good luck!
See more: