
The Stochastic indicator is a popular technical analysis tool used by traders to assess price momentum and identify potential entry opportunities. However, understanding and using this indicator effectively is not always easy. This article from Tipstrade.org will provide you with insights into how the Stochastic indicator works, while also guiding you on how to optimize its use for making more accurate trading decisions and improving your investment performance.
What is a Stochastic indicator?
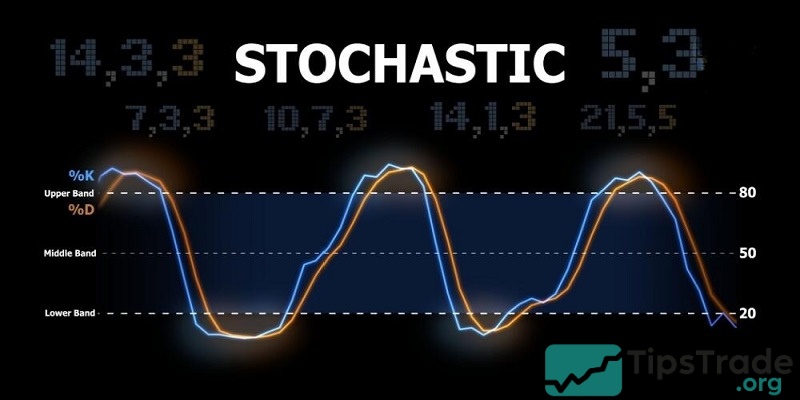
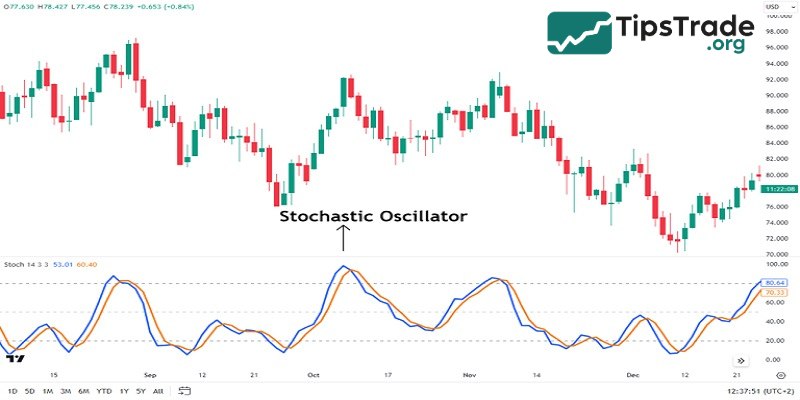
The Stochastic indicator (also known as the Stochastic Oscillator) is an important technical analysis tool widely used in financial trading to assess price momentum and identify potential entry points. It belongs to the group of momentum indicators, which indicate the speed and momentum of price, rather than focusing solely on absolute value.
The Stochastic indicator measures the closing price relative to the price range over a given period. It helps identify overbought and oversold price zones, thereby predicting the potential for trend reversals.
>>See more:
- What is the MACD Indicator and How to Use It?
- The ADX Indicator: What Is It And How To Use It?
- Moving Averages and how does it use to find the trend
- What is the CCI indicator? Formula for calculating CCI in TA
The origin of the Stochastic indicator
The Stochastic indicator was developed by George Lane, a renowned technical analyst, in the 1950s. Initially, he used it to analyze the commodity market. Subsequently, it was widely adopted in many other financial markets, including stocks, foreign exchange, and cryptocurrencies.

Components of the Stochastic indicator
The Stochastic indicator consists of three main components:
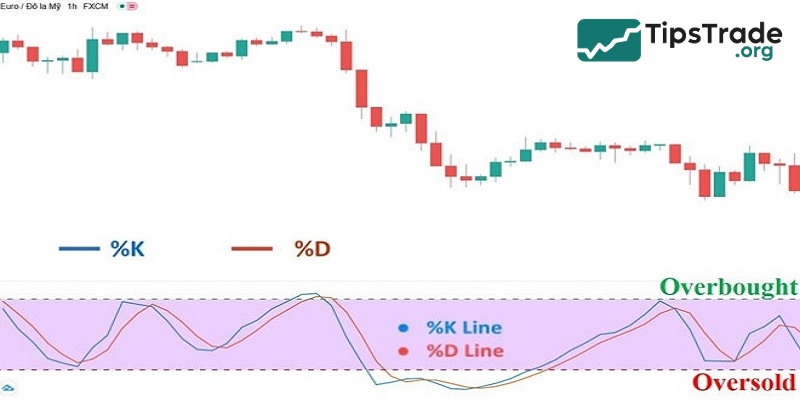
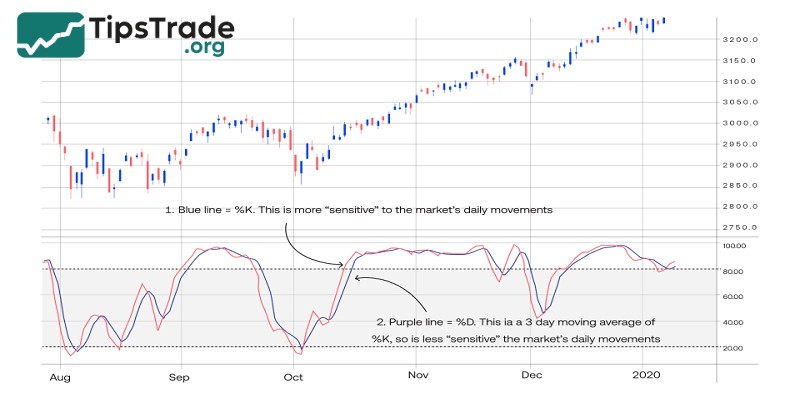
– %K line (blue): This is the main oscillator line, also called Stochastics after George Lane, as it reflects the most recent price range over the selected time period.
– %D line (orange): This is the moving average of the %K line, calculated using a 3-period Simple Moving Average (SMA3). Therefore, the %D line lags behind the %K line.
– Boundary lines: Two default boundary levels are set at 20 (lower boundary) and 80 (upper boundary), which help identify overbought and oversold zones.
- When the indicator crosses above the 80 level, it signals that the market is in an overbought condition. This also warns that the upward trend may be at risk of reversal.
- On the other hand, if the indicator drops below the 20 level, it indicates the market is in an oversold condition, suggesting that the price may be nearing a bottom and could soon reverse upward.
Stochastic indicator formula
The formula for calculating the Stochastic Oscillator is as follows:
%k = (Last Closing Price – Lowest Price)/(Highest Price – Lowest Price) x 100
%D = 3-day SMA of %K
Where:
- C is the last closing price
- Lowest Low is the lowest low for the time period
- Highest High is the highest high for the time period
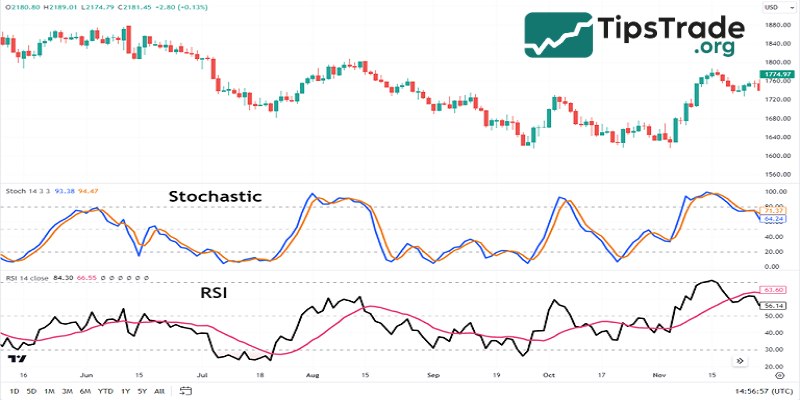
The relationship between stochastic and RSI indicator
There are quite a few similarities between the RSI indicator and the Stochastic indicator. Both of these tools are price momentum oscillators and are widely used by traders. To increase the accuracy of buy or sell signals, traders often combine the Stochastic Oscillator and RSI. Although the goals of these two technical indicators are quite similar, their underlying theories are different.
Accordingly, the Stochastic indicator is based on the theory that the price of an asset tends to close near its highest level in uptrends and near its lowest level in downtrends. Conversely, the RSI indicator works by measuring the rate of price change of an asset. When the market is in a clear trend, the RSI is very useful for identifying overbought and oversold areas. However, the Stochastic indicator works better when the market is sideways or fluctuating erratically.
Using the Stochastic indicator in trading
The following are the primary uses of the stochastic indicator:
Identify market trends
Using the %K and %D lines:
- When %K and %D are both above 50, it indicates an upward trend is underway.
- When %K and %D are both below 50, it indicates a downtrend is underway.
Combined with other tools: To determine trends more accurately, you should combine the Stochastic Oscillator with other technical analysis tools, such as Moving Averages or Trendlines.
Finding buy and sell signals
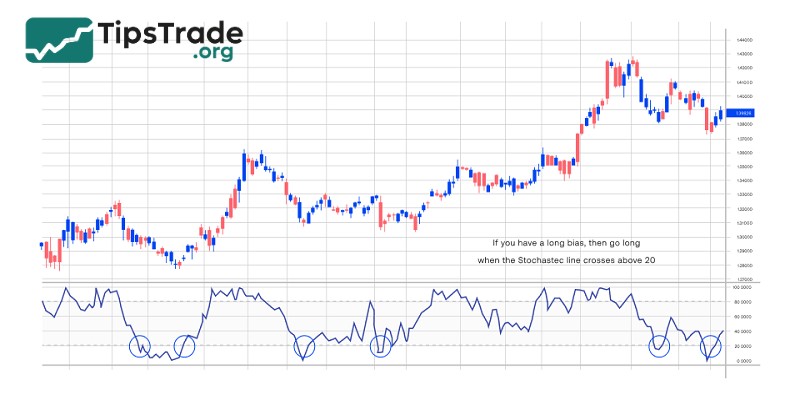
In trading, using the Stochastic indicator to identify buy and sell signals is an important part. A buy signal appears when the %K line crosses above the %D line from below, indicating increasing momentum and the potential for price appreciation. This signal is even stronger when both the %K and %D lines are below the oversold level (20), indicating that the market is oversold and likely to reverse upwards.
Conversely, a sell signal appears when the %K line crosses below the %D line from above, indicating decreasing momentum and a potential price decline. This signal is even stronger when both the %K and %D lines are above the overbought level (80), indicating that the market is overbought and likely to reverse downwards.
Identify overbought and oversold levels
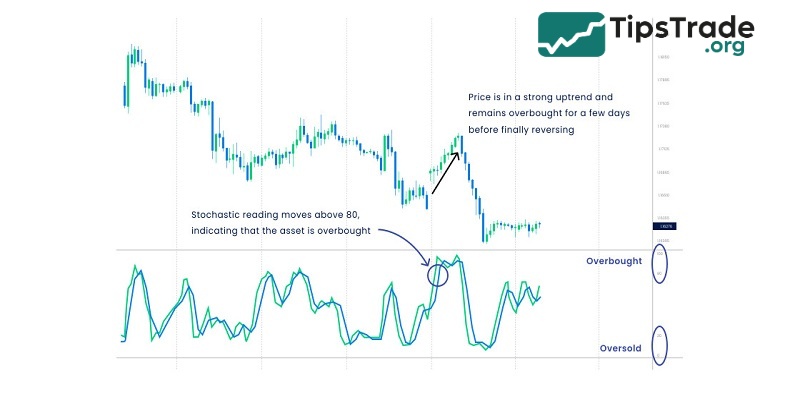
In technical analysis, the Stochastic indicator not only helps identify buy and sell signals but also allows traders to recognize overbought and oversold areas in the market. An overbought zone is marked when the %K or %D line crosses above 80, indicating the market may have grown excessively and is likely to reverse downwards.
Conversely, an oversold area appears when the %K or %D line falls below 20, signaling that the market may have been oversold and is likely to reverse upwards. Accurately identifying these zones can assist traders in making decisions about taking profits or seeking buying opportunities when prices show signs of recovery.
Combining the Stochastic indicator with other indicators
- Increase reliability: To increase the reliability of trading signals, you should combine the Stochastic Oscillator with other technical indicators, such as RSI, MACD, or ADX.
- Multidimensional analysis: Combining the Stochastic Oscillator with other indicators gives you a multidimensional view of the market, leading to more accurate trading decisions.
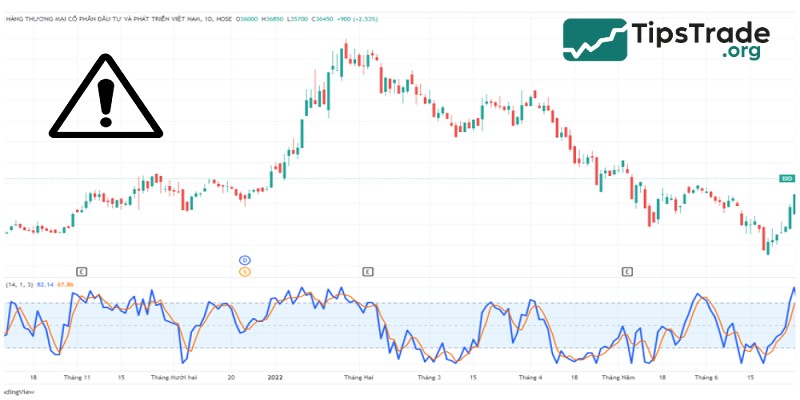
Notes when using the stochastic indicator
Based on the Stochastic indicator, it is possible to identify overbought and oversold points in the market to enter trading orders. However, during the trading process, investors also need to understand the following rules:
- No indicator can provide a 100% accurate signal, and the Stochastic oscillator is no exception. Therefore, investors need to combine this with other indicators to accurately determine market trends.
- The larger the timeframe for the Stochastic indicator, the more accurate the signals and the less deviation.
- Trading with the market trend will be the first and most essential condition if investors want to bring home trading profits. If you trade against the trend, it will definitely bring high risks. Therefore, new investors in the field need to pay special attention.
Conclusion
The Stochastic indicator is a useful technical analysis tool that assists traders in capturing price momentum and identifying overbought/oversold zones. However, to use this indicator effectively, it is very important to understand its operating principles clearly. At the same time, traders need to avoid common mistakes and combine the Stochastic indicator with other technical analysis tools to gain a comprehensive view of the market.
See more: