

The RSI indicator is used to measure the magnitude of price changes over the most recent period, helping investors identify whether the market is overbought or oversold. In this article, Tipstrade.org will help you understand what the RSI indicator is, its calculation formula, and how to effectively apply the RSI to optimize your trading!
What is the RSI indicator?
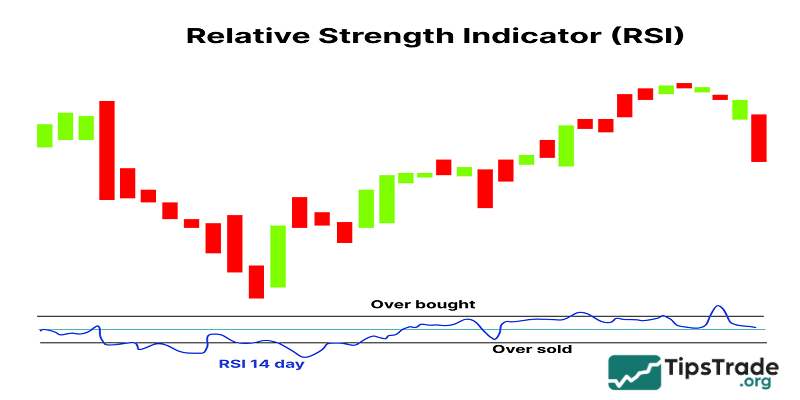
The RSI indicator is an abbreviation for Relative Strength Index, a type of momentum indicator used in technical analysis. This index is used to measure the degree of change in the prices of financial assets. Through this, investors can assess whether the overall sentiment for that asset is overbought or oversold. From there, they can make appropriate buy-sell decisions.
The RSI is displayed as an oscillator chart (a line graph moving between two extreme points) and can have values from 0 to 100. This indicator was initially developed by J. Welles Wilder Jr. The RSI was first introduced in the 1978 book “New Concepts in Technical Trading Systems.”
>>See more:
- What is the MACD Indicator and How to Use It?
- Moving Averages and how does it use to find the trend
- The ADX Indicator: What Is It And How To Use It?
- A Complete Guide to Using the Stochastic Indicator from A–Z for Beginners
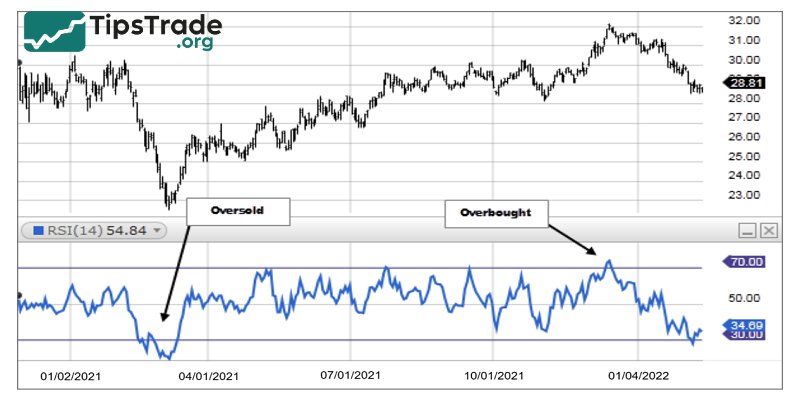
Overbought and oversold conditions
The terms “overbought” and “oversold” are used to describe extreme market conditions:
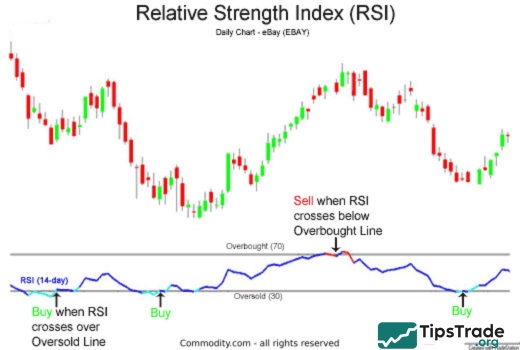
- Overbought: When the price of an asset rises sharply to a level considered too high or unsustainable. An RSI indicator exceeding 70 will signal this condition.
- Oversold: When the price of an asset drops sharply to a level considered too low or undervalued compared to its true worth. An RSI indicator below 30 will signal this condition.
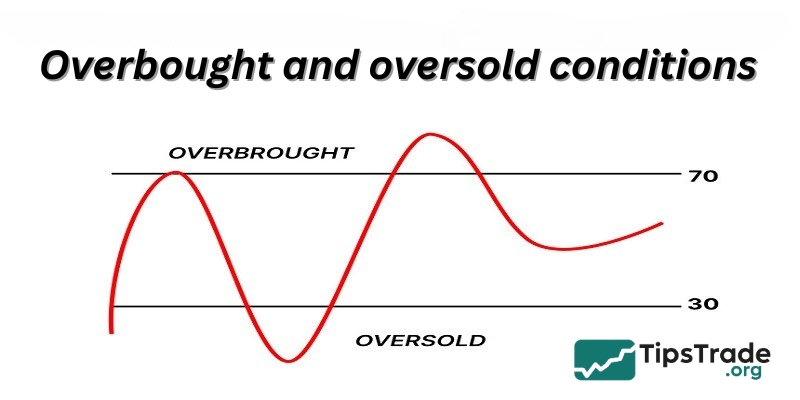
Note that overbought conditions do not mean prices will immediately decrease, and oversold conditions do not mean prices will immediately increase. These states can last throughout a strong trend.
How the RSI indicator works
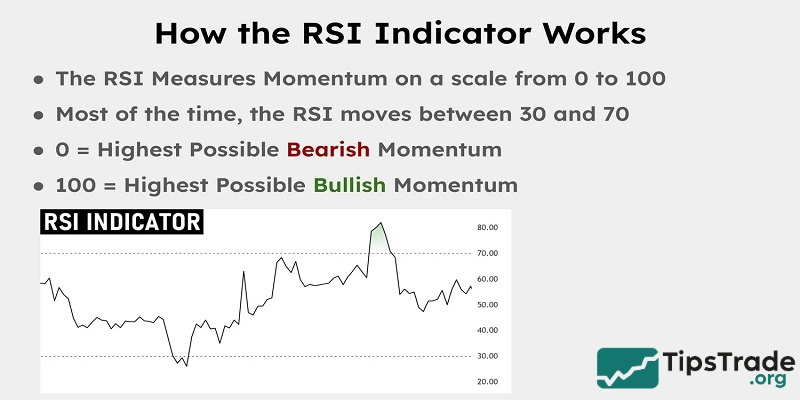
The RSI measures momentum on a scale of 0 to 100. Accordingly:
- Above 70: The asset is considered overbought, indicating strong bullish momentum.
- Below 30: The asset is considered to be oversold, indicating strong bearish momentum.
- Between 30 and 70: The asset is considered to be in a neutral momentum state.
There will be very rare times when the RSI indicator reaches extreme values like 0 or 100. Most of the time, the RSI fluctuates between 30 and 70. However, during strong trends, the RSI can rise above 70 or fall below 30, signaling the possibility of overbought or oversold conditions.
Calculating the RSI indicator
Calculation of the RSI, to be done thoroughly, requires a great deal of highly technical and complex explanations. To fully understand how the calculation is accomplished, traders and analysts should read Wilder’s own explanation. It is presented in his 1978 book, New Concepts in Technical Trading Systems.
However, the index can be broken down into a (fairly) simple formula:
RSI = 100 – [100 / (1 + (Average of Upward Price Change / Average of Downward Price Change)]

How to interpret an RSI indicator
- Overbought (RSI above 70): This indicates that the asset has experienced strong upward momentum and may be about to enter a correction or downtrend.
- Oversold (RSI below 30): This indicates that the asset has experienced a strong downward momentum and may be due for a rebound or bullish reversal.
Using the RSI indicator in trading
Below are trading strategies that help traders use the RSI indicator more effectively:
Identifying potential reversals with divergences
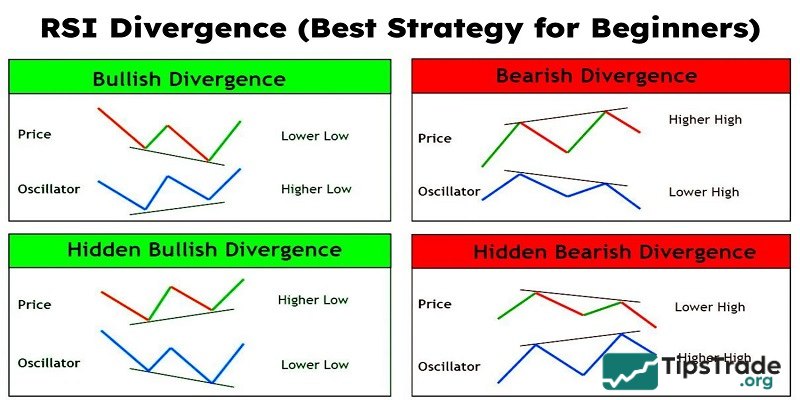
For this strategy, traders should look for divergence signals between the RSI and price movement. Accordingly:
- When the price forms a lower low, but the RSI forms a higher low, this is called bullish divergence. This suggests that the declining momentum is weakening and a bullish reversal is likely.
- Conversely, when the price makes higher highs, but the RSI makes lower highs, a bearish divergence will form. This indicates that the upward momentum is weakening and could lead to a bearish reversal.
Confirming trends
Traders can also use the RSI indicator to confirm the strength of a trend. Accordingly:
- Confirming an uptrend: In an uptrend, the RSI typically stays above 50 and often bounces from the 40-50 range.
- Confirming a downtrend: In a downtrend, the RSI typically stays below 50 and often bounces off the 50-60 range.
Overbought and oversold strategy
Overbought and oversold conditions can help traders identify potential trading opportunities, although they are not independent signals:
- Strategy with overbought conditions: In a downtrend, when the RSI falls into the overbought zone, this could signal a potential entry point for short positions.
- Strategy with oversold conditions: In an uptrend, when the RSI falls into the oversold zone, this could signal a potential entry point for long positions.
Combining RSI with other indicators
When combined with other technical indicators, the reliability of the RSI signal will be significantly increased. For example:
- Moving averages: Used to determine the overall direction of the trend.
- Support and resistance levels: Helps identify potential entry and exit points for trades.
- Candlestick patterns: Provide additional confirmation signals regarding a potential reversal.
Limitations of the RSI indicator
RSI is generally just a supporting indicator. It can’t be 100% completely accurate; there are always potential risks. Therefore, investors need to use it in conjunction with other tools to make accurate judgments.
In a highly volatile market, assets can surpass the 70 threshold, then continue to move deep into overbought territory, or fall below 30 and continue to move deep into oversold territory.
Additionally, if the market experiences strong fluctuations, the price of the asset can still increase. If the volatility is too great, set a suitable threshold for yourself to behave appropriately. Nevertheless, overall, the RSI still performs well in more stable markets.
How RSI works in different markets
The RSI indicator is very versatile and it can be applied to many different financial markets. Specifically:
RSI stock trading
- Identify stocks with the potential to reverse: Use the RSI to find stocks that are overbought and likely to correct.
- Earnings reports: Be cautious during financial report releases, as they can cause significant price volatility and impact RSI signals.
RSI forex trading
- Currency pairs: Apply RSI to major and minor currency pairs to detect reversal signals or trend continuation.
- Economic news: The Forex market is sensitive to economic data, so traders should combine fundamental analysis with RSI signals.
RSI crypto trading
- High volatility: The cryptocurrency market is often very volatile. Thanks to the RSI indicator, it can help you identify overbought or oversold conditions in this volatile market.
- Adjusting sensitivity: You may need to adjust the RSI settings to accommodate the higher volatility of the crypto market.
Tips for using the RSI indicator
- Limit the use of RSI in isolation: To increase signal reliability, traders should always combine RSI signals with different technical analysis tools such as price action and market structure.
- Be cautious of false signals: RSI can generate inaccurate overbought or oversold signals during periods of sideways or unclear market movement.
- Always stay updated on market news: Basic factors can affect price fluctuations; therefore, pay attention to news events that could impact your trading.
- Risk management practice: Use stop-loss orders and position sizing to protect trading capital.
Final thoughts
In summary, the RSI indicator is an extremely useful technical indicator that helps traders identify important market signals. By understanding how the RSI works and applying it effectively, you can enhance your analysis skills and make smarter trading decisions. Wishing you successful investments!
See more: