
If you are a trend trader, you need to know about the ADX indicator. This is a highly regarded tool for measuring trend strength today. So, do you know what the ADX indicator is? How can you use this indicator most effectively in your trading strategy?
What is the ADX indicator?
ADX indicator explained
The full name of the ADX indicator is the Average Directional Index. It is one of the most commonly used technical analysis indicators to measure the strength of market trends. ADX ranges in value from 0 to 100. The higher the ADX value, the stronger the trend at that time.
The ADX indicator was developed by Welles Wilder in 1978 with the purpose of being a strength indicator for the commodities market. Currently, this indicator is widely used in markets such as forex and stocks.
>>See more:
- What is the MACD Indicator and How to Use It?
- Moving Averages and how does it use to find the trend
- Understanding Volume Indicator: A Comprehensive Guide
- Top 5 best technical indicators you shouldn’t miss
Components of the ADX indicator
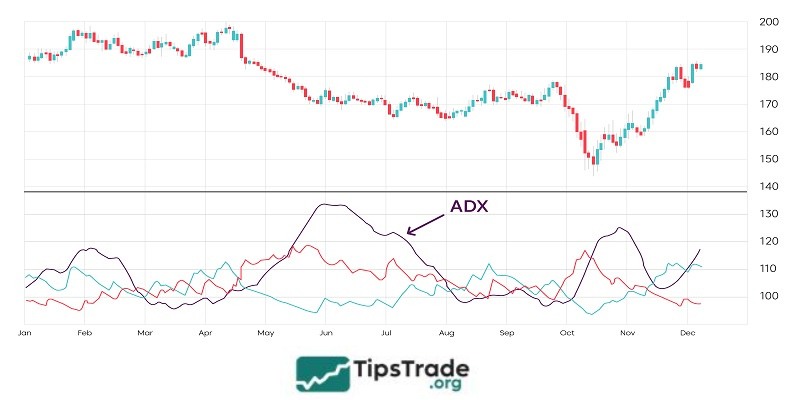
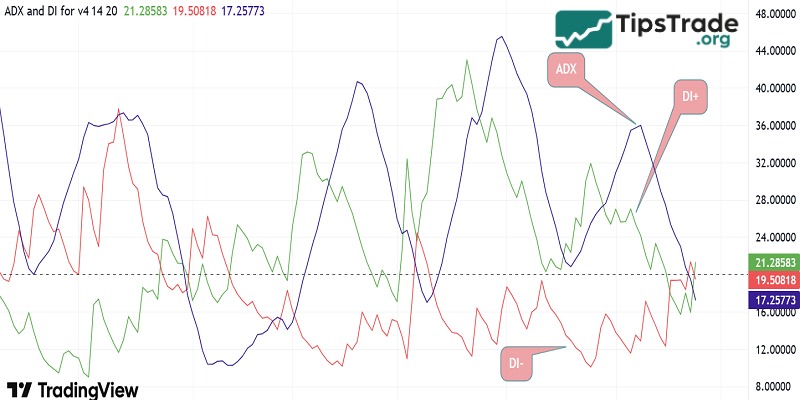
ADX consists of 3 main components: ADX, +DI, and -DI.
- ADX: The solid brown line is the trend strength indicator.
- +DI: The solid blue line is the positive indicator line.
- -DI: The solid red line is the negative index line.
Where:
- The ADX line predicts whether a new market trend is being established.
- If +DI is above -DI, it signals that the market is in an uptrend.
- If +DI is below -DI, it’s a signal that the market is in a downtrend.
The importance of the ADX indicator
The ADX indicator, similar to other technical indicators, plays an important role in supporting traders in analyzing and making decisions in financial markets, especially in forex and stocks. Here are some notable applications of ADX:
- Measuring price volatility: ADX helps measure the average price volatility over a given period, typically 14 days. This provides an overview of market stability or instability.
- Market trend analysis: The ADX indicator not only helps identify trends but is also used in conjunction with other analysis tools to develop more effective trading strategies.
- Determine price direction: Based on ADX, traders can assess whether the price is trending up or down. This helps to accurately track and stay on top of market trends.
- Detecting the momentum of a trend: ADX allows for the timely identification of changes in trend strength by analyzing the peaks and troughs of this indicator.
ADX indicator calculation
The ADX calculation involves four steps that transform price movement into a measure of trend strength:
Step 1: Calculation of the directional movements
- Positive Directional Movement (+DM) = Current High – Previous High (if positive and greater than -DM)
- Negative Directional Movement (-DM) = Previous Low – Current Low (if positive and greater than +DM)
Step 2: Wilder’s smoothing using the Average True Range (ATR)
- +DI = 100 × (Smoothed +DM ÷ ATR)
- -DI = 100 × (Smoothed -DM ÷ ATR)
Step 3: Directional Index (DX) calculation
- DX = 100 × |+DI – -DI| ÷ (+DI + -DI)
Step 4: ADX calculation as a smoothed average of DX values
- ADX = ((Previous ADX × 13) + Current DX) ÷ 14 (for the standard 14-period setting)
Using ADX indicator in trading
Many traders use the ADX indicator in order to find a good trade setup. Here’s how conventional traders use it effectively. And below is how conventional traders use it effectively:
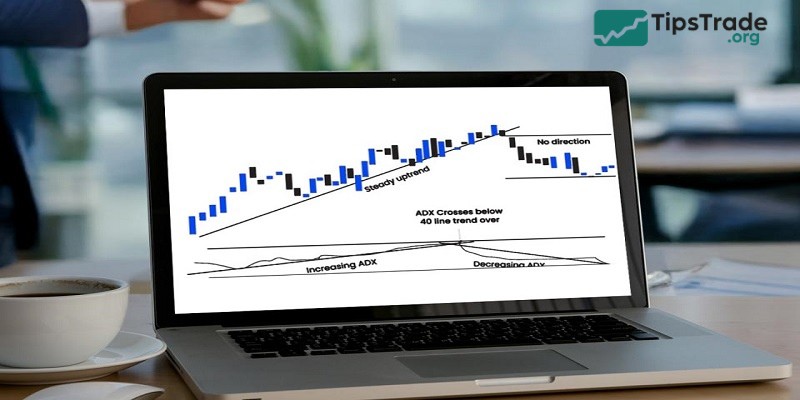
Identifying strong trends
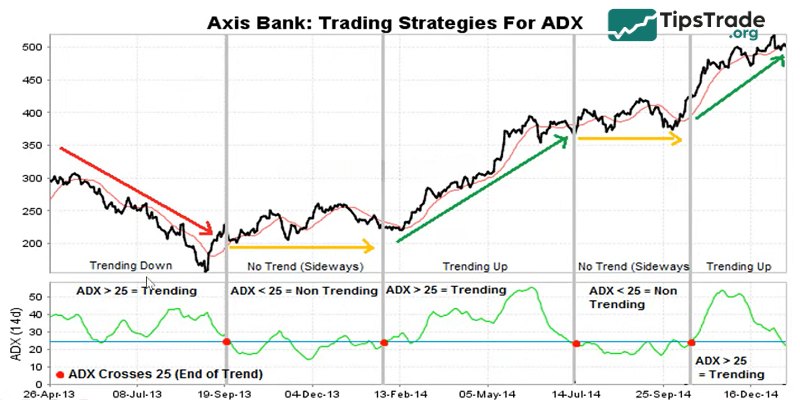
First, the ADX indicator is often used by traders to determine whether the market is in a strong trend. When the ADX line is at the following levels:
- Trades in the range of 0-25: Weak or not trend, more likely a sideways trade
- Trades in the range of 25-50: Moderately strong trend
- Trades in the range of 50-75: Indicates a strong trend
- Trades in the range of 75-100: Indicates a very strong trend.
All these help in just knowing the strength of the trend, with the traders can check whether the current price momentum is going to survive or not.
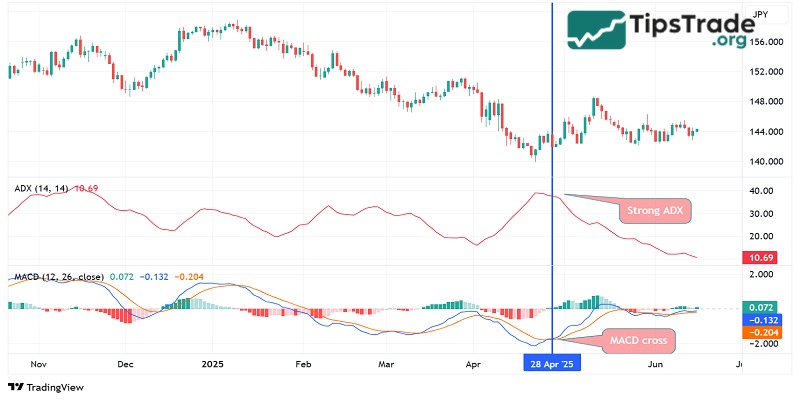
Combining ADX indicator with other strategies and indicators
The ADX indicator when used alone will not bring optimal efficiency. However, when combined with other indicators, you will see a significant improvement in accuracy. For example:
- With moving averages: If the trend confirmed by ADX is also highlighted by EMA and SMAs then it is a green signal.
- With RSI (Relative strength index): The overbought and oversold situation confirmed by RSI when used with knowledge of ADX, then traders can find more reliable trades.
Entry and exit signals
The ADX along with its other two lines +DI and -DI can help traders know when to enter and exit the trade.
- Buy signal: When +DI is above -DI and ADX is trading in the range of 75-100
- Sell signal: When +DI line is below -DI line and ADX line is in range of 75-100
- Exit signal: If ADX lines start falling suddenly, it means that the price trend is weakening.
Limitations of ADX indicator
The ADX indicator also has certain limitations that need to be noted as follows:
- Signal lag: One of the main limitations of the ADX is signal lag, as it relies on historical data for calculations. This could cause traders to miss out on some opportunities in fast-moving markets.
- Short-term performance decline: This indicator performs better over longer timeframes. When applied to short timeframes, the signals can be less accurate, leading to difficulties in making trading decisions.
- Lack of information about specific price action: The ADX indicator does not provide information related to divergence or convergence, which can reduce the ability to analyze price action in a more detailed and comprehensive manner.
Tips for beginners using ADX indicator
When trading with trends and analyzing fluctuations using the ADX indicator, traders should pay close attention to the following points:
- Each technical indicator has its own strength and meaning. The ADX line is useful for determining trend strength but does not indicate the direction of the market. Therefore, traders need to combine this indicator with other indicators and data. The more consensus signals you receive, the less noise there is likely to be, and the higher the probability of a successful trade.
- Traders analyzing ADX need to follow market trends. Depending on the specific situation, the trader chooses a position and enters the trade. Only then can you ensure the highest level of safety for your portfolio.
Conclusion
The ADX indicator is an effective tool in technical analysis. They can determine the strength of the trend, which complements indicators that are solely used to identify trends. With ADX, investors will gain deeper insights when investing based on price trends. Through this article, we hope traders have gained more knowledge about the ADX indicator and how to use it in investing!