
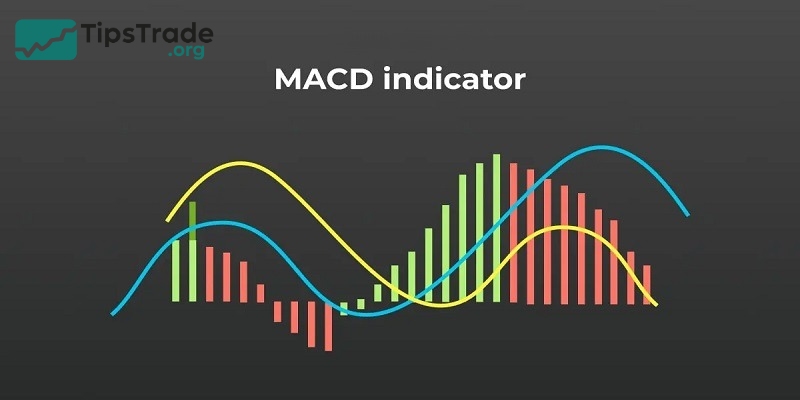
The MACD indicator is a widely used and very helpful technical indicator for investors. Understanding how to use the MACD effectively can help you find precise buy and sell points. Let’s learn about this useful indicator with Tipstrade.org in the article below!
What is the MACD indicator?
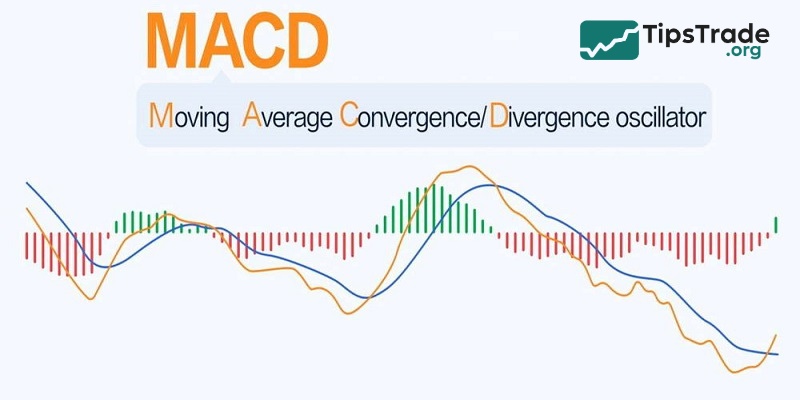
The MACD indicator, which stands for Moving Average Convergence Divergence, was developed by Gerald Appel in 1979. MACD is classified as a lagging indicator, providing signals based on price action or price data that has already occurred in the past.
>>See more:
- The ADX Indicator: What Is It And How To Use It?
- Moving Averages and how does it use to find the trend
- Support and Resistance: Basic Guide for Investors
- Top 5 best technical indicators you shouldn’t miss
How does MACD indicator help traders?
- Trend identification: MACD helps in determining the direction and strength of market trends, such as uptrends, downtrends, or sideways movements.
- Momentum analysis: It provides insights into the momentum of asset price movements, aiding traders in assessing the speed and vigour of price changes.
- Trend reversal signals: MACD generates indicator signals when the MACD line crosses above (bullish) or below (bearish) the signal line, indicating potential trend reversals, which are valuable for traders seeking optimal entry or exit points.
- Overbought and oversold conditions: The distance between the MACD line and the zero line can indicate overbought or oversold conditions, helping traders make decisions about whether to buy or sell assets.
- Timing buy and sell decisions: By offering clear buy and sell signals, MACD assists traders in making well-informed decisions to maximise profits and minimise losses.
How the MACD indicator works
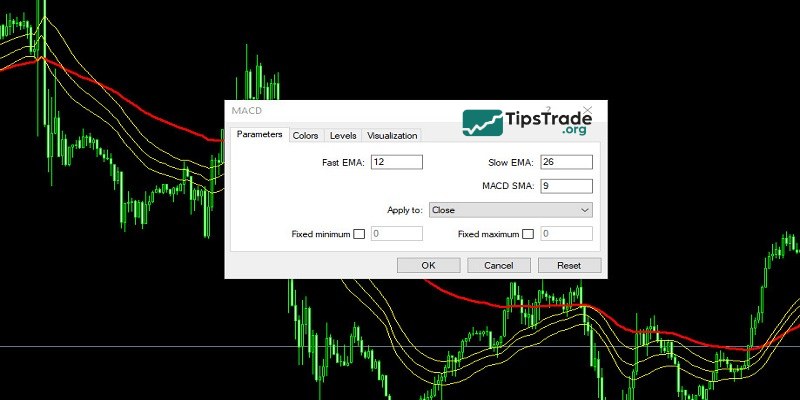
Usually, the MACD indicator is calculated from two exponential moving averages (EMA). The standard MACD uses the following three parameters:
- 12-period EMA: This EMA reflects short-term price momentum. A shorter period EMA will react more quickly to price movements than a longer period EMA.
- 26-period EMA: This EMA reflects long-term price momentum. The 26-period EMA reacts slower than the 12-period EMA.
- Signal line (9-period EMA of MACD): This line follows the MACD and acts as a buy/sell signal trigger line.

Components of the MACD indicator
The MACD indicator consists of 3 components:
- The MACD line
- The signal line
- The histograms
Let’s break down each component and understand how they work together.
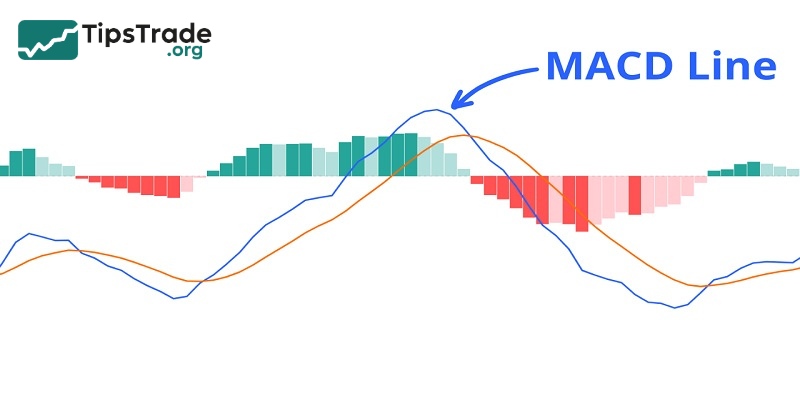
MACD line
MACD line = 12d EMA – 26d EMA
The MACD line helps identify upward or downward momentum (market trend). This line is calculated by finding the difference between the two exponential moving averages, EMA 12 and EMA 26.
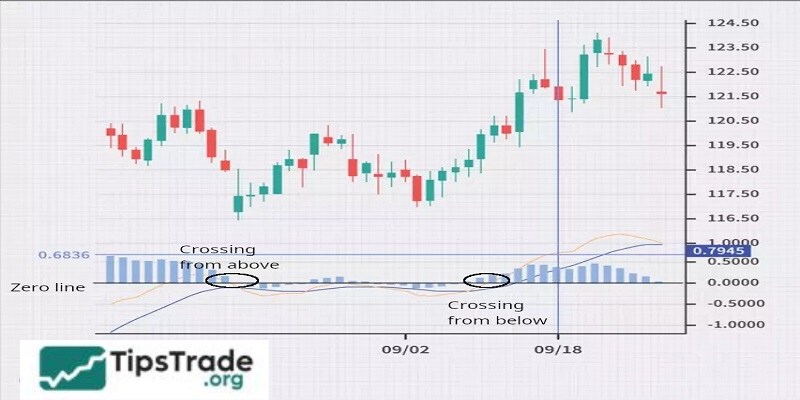
The MACD line oscillates above and below the zero line, which signals crossovers of the central lines, informing traders when the 12-day EMA and 26-day EMA change their relative positions.
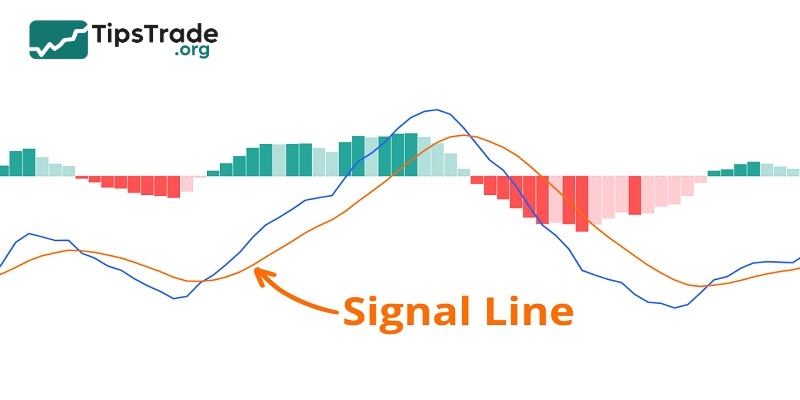
Signal line
Signal line = 9d EMA of MACD line
The Signal line is formed from the 9-period Exponential Moving Average (EMA) of the MACD line itself, which was formed earlier.
Although it’s not always possible to pinpoint the exact intersection of the MACD line and the signal line, these events are often considered reversal signals, especially when they occur at the extreme points of the MACD chart (above or below, far from the zero line).
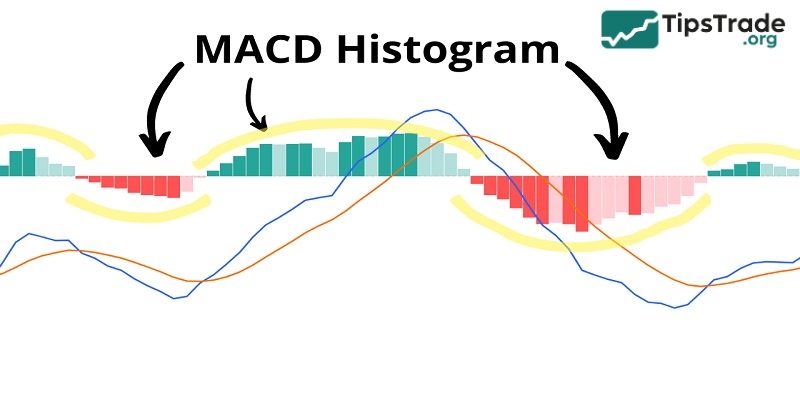
MACD histogram
MACD histogram = MACD line – signal line
The histogram is a visual record of the relative movements of the MACD line and the signal line. It is calculated simply by finding the difference between these two lines.
However, instead of adding a third flow line, the chart is created with columns, making it easier to read and understand. Note that the columns of histogram have nothing to do with trading volume.
How to read MACD indicator
There are three main methods that traders can apply in analyzing MACD to generate trading signals:
- Bullish and bearish crossovers: When the MACD line crosses above the signal line, it is a buy signal because the bullish momentum is increasing. Conversely, when the MACD line crosses below the signal line, it is a sell signal because the bearish momentum is increasing.
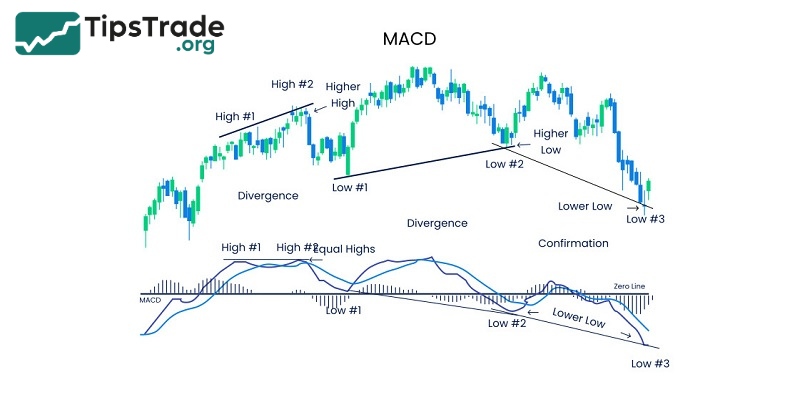
- Divergence signals: When the MACD forms higher highs or lower lows relative to the price, this indicates a possible reversal, as momentum does not confirm the price trend. Traders will act when the price finally moves in the direction of the MACD divergence.
- Histogram analysis: Traders also watch for changes in the MACD histogram from positive to negative (or vice versa) to identify momentum shifts, especially when combined with crossover signals.
How to use the MACD indicator when trading
The MACD indicator is commonly used by traders to identify suitable entry and exit points in line with the current trend. A buy signal appears when the MACD line crosses above the Signal line and the histogram is expanding; a sell signal appears when the MACD line crosses below the Signal line and the histogram is contracting. When the histogram narrows, it indicates weakening momentum, signaling a potential trend reversal or a market shifting to sideways movement, prompting traders to consider exiting their positions.
Additionally, traders should set stop-loss orders based on key technical levels to effectively manage risk. For example: You can place a stop-loss below the nearest swing low or below the 200 EMA line (for Buy orders); or above these levels (for Sell orders). In case you trade based on divergence signals, the stop-loss should be placed beyond the nearest extreme price level.
To avoid exiting a trade too early when trading divergence, setting a stop-loss beyond the nearest extreme price level will help limit exiting the trade before the trend truly forms.
How to install the MACD indicator on popular trading platforms
Learning how to set up the MACD indicator on trading platforms can boost your trading strategy. Here’s a detailed step-by-step guide on how to install the MACD indicator on the popular platforms Metatrader and Tradingview.
Metatrader platform
- Open MetaTrader and pick the asset you want to trade.
- Click “Insert” in the top menu, then “Indicators.”
- Look for “Custom” or “Trend” and find “MACD.”
- Change the parameters as you like and click “OK.”
Tradingview platform
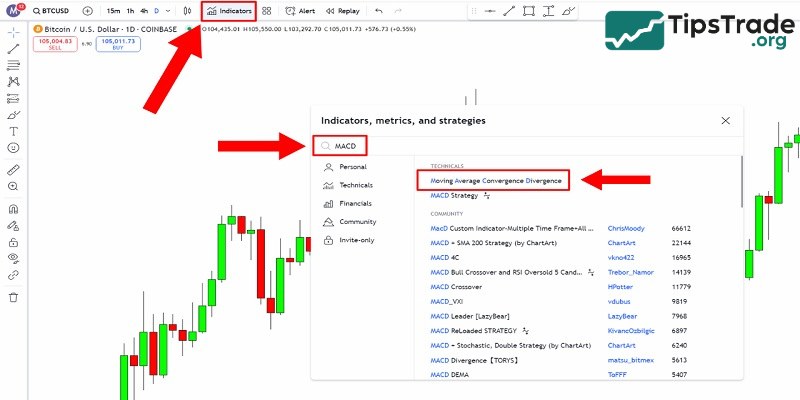
- Log in to TradingView and open your chosen asset’s chart.
- Click “Indicators” at the top.
- Search for “MACD” and pick it from the list.
- Adjust the settings to your liking.
Some limitations of the MACD indicator
Despite its important role in identifying market trends, the MACD indicator still has a few limitations, as follows:
- Convergence/divergence signals can indicate a reversal but are not entirely accurate, sometimes being false or noisy signals. You need to use additional interwoven indicators for easier identification.
- Investors tend to set indicators for personal purposes, so the data gradually becomes more subjective and less realistic.
- The indicators can cause a lag in the interference between moving averages, resulting in the signal received being slower than the trend compared to market trends.
- Determining signals through the MACD indicator is very complex, requiring investors to be experienced, market-sensitive, and well-versed in suitable trading hours.
MACD trading strategies for beginners
The MACD indicator is a great trading tool for beginners. It offers a variety of trading strategies that are easy to learn and apply. By understanding and using these strategies, new traders can make better decisions and can improve their trading results.
The zero-line bounce strategy
This strategy uses the MACD histogram to find trading opportunities. When the histogram bars bounce off the 0 line, it indicates that the trend is likely to continue. Beginners can use this signal to determine when to enter or exit a trade.
MACD with support and resistance
Using MACD along with support and resistance levels provides a clearer view of the market. By identifying support/resistance zones and using MACD to confirm signals, traders can make smarter decisions.
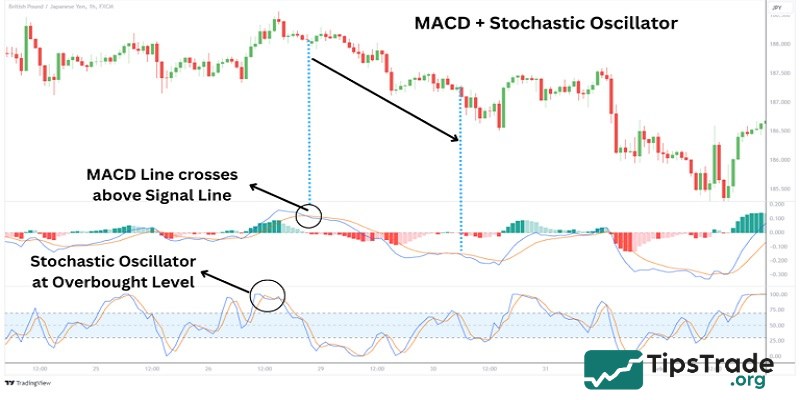
Combining MACD with other indicators
To increase the effectiveness of the MACD indicator, traders can combine it with other indicators. For example, combining the MACD with the Relative Strength Index (RSI) or Bollinger Bands helps to confirm the signals more clearly. This also helps to reduce the risk of false signals.
Final thoughts
The above is an analysis of the MACD indicator and detailed instructions on how to use MACD in trading for the highest efficiency. Follow Tipstrade.org to learn more interesting knowledge about Technical analysis in financial investment!