
Moving averages are one of the commonly used tools in technical analysis, used to track price fluctuations in the market. So, what are moving averages? How can investors use moving averages most effectively to find the trend? Let’s explore this together in the article below.
What are moving averages?
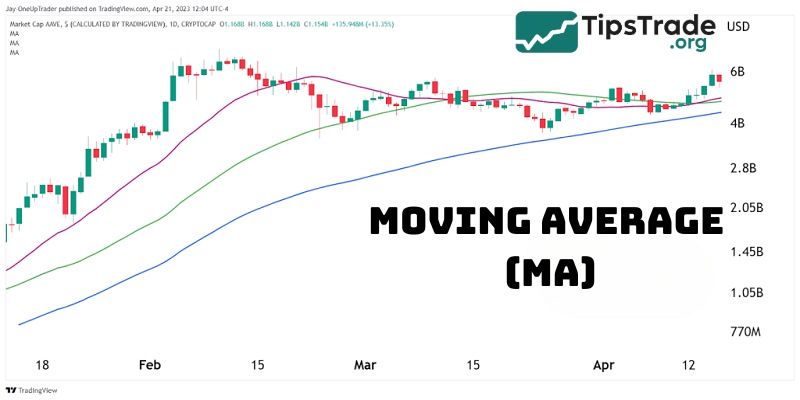
Moving averages (MA) are one of the most basic and widely used technical analysis tools in stock, currency, or coin investment. This is a type of line chart that smooths out price fluctuations, making it easier for investors to identify trends and make informed trading decisions.
How does a moving average function?
Here’s how moving averages work:
Moving averages work by taking the closing price of an asset over a set number of time periods (e.g. the last 10 days), adding them all up, and dividing by that number of time periods.
The result is a single value displayed on the chart. Each new time period removes the oldest price and adds the newest price, creating a “moving” line that reflects the price trend over time.
What is the purpose of moving averages?
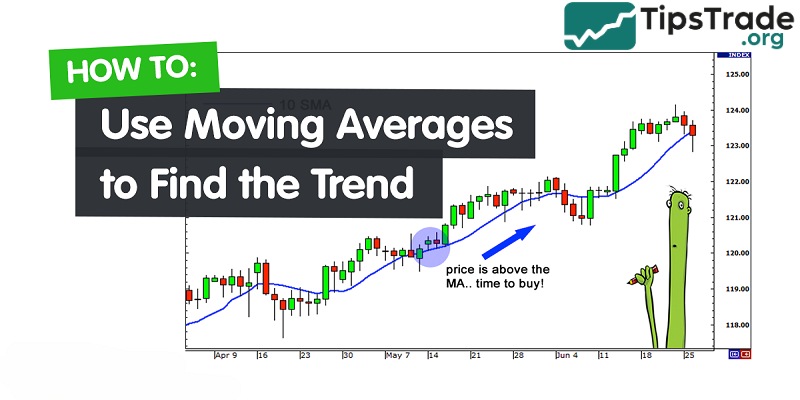
Helping investors determine the direction of the trend is the main goal of a moving average.
- If the price is above the moving average, it usually indicates an uptrend.
- Conversely, if the price is below the moving average, it is usually a sign of a downtrend.
Moving averages are also used to spot reversal points, entry/exit signals, and identify dynamic support and resistance zones.
How to calculate a moving average
It’s not too complicated for you to calculate a moving average. Say you want a 5-day moving average. Just take the closing prices of the last five days, add them together, and divide by five. That’s it.
This average is plotted on your chart. The next day, drop the first price, add the newest one, and calculate again.

Types of moving averages
The moving averages are a useful technical analysis tool in financial investment. There are many types of moving averages, including the following three that are most commonly used:
Simple moving average (SMA)
Simple moving average, also abbreviated as SMA. SMA will be calculated by taking the average of that price over a specific period. It can help us determine whether the price will continue to follow the trend or go in the opposite direction.
The SMA line is divided into 3 common types:
- Short-term SMA lines: SMA10, SMA14, SMA20.
- Mid-term SMA: SMA50.
- Long-term SMA: SMA100, SMA200
Formula for calculating SMA: SMA = (P1 + P2 +…+ Pn) / n
Where:
- P1, P2, Pn are the closing prices over the period n.
- n is the defined time interval.
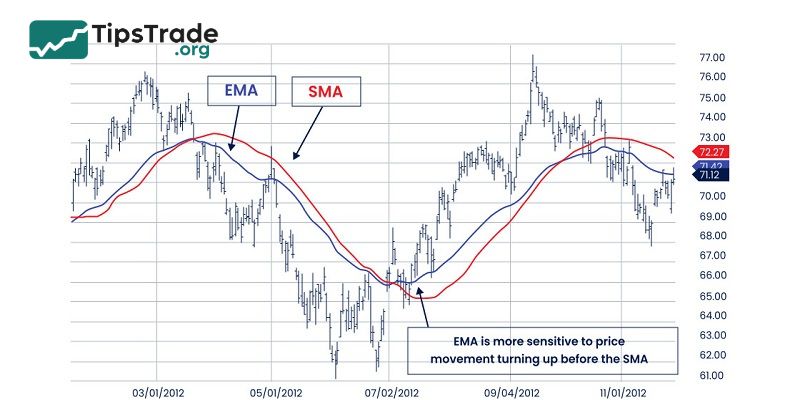
Exponential moving average (EMA)
Exponential moving average, also abbreviated as EMA, which appears when there are short-term price fluctuations and is calculated only for the most recent period. This allows investors to clearly understand short-term fluctuations in the market. From this, one can react quickly and timely to short-term price fluctuations. However, the EMA line is fast-moving, so false signals are inevitable.
Common types of EMA:
- Short-term EMA lines: EMA5, EMA8, EMA13,…
- Medium-term EMA lines: EMA21, EMA25, EMA75,…
- Long-term EMA lines: EMA100, EMA200
Formula for calculating EMA: EMA = Pt x k + EMAy x (1 – k)
Where:
- Pt: This is the current closing price.
- k = 2 / (number of days in the EMA cycle + 1).
- EMAy: The value of the previous day’s EMA.
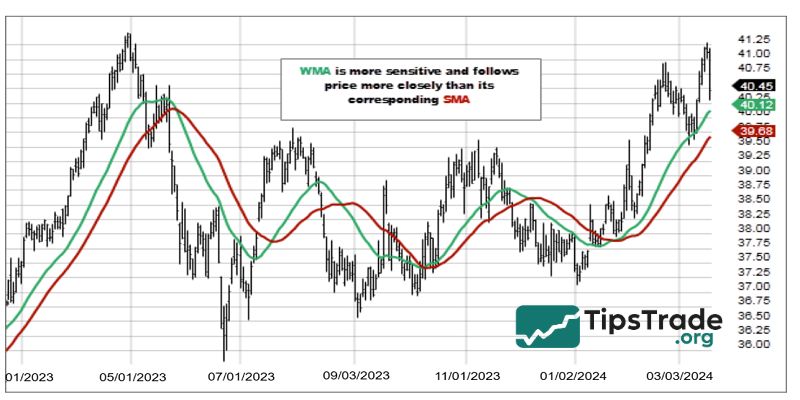
Weighted moving average (WMA)
Weighted moving average, also abbreviated as WMA. This is a technical indicator used to identify recent signals. Therefore, it will not be affected by past data. For this reason, the WMA can overcome the drawbacks of both the SMA and the EMA.
Formula for calculating EMA: WMA = [P1 x n + P2 x (n – 1) + … + Pn] / [n x (n + 1)] / 2
Where:
- Pn: Price level during period n.
- n: Time period.
What is the best type of moving average to use?
What is the best type of moving average to use? This depends on your trading goals, style, and timeframe.
| Type | Best for | Key advantages | Limitations |
| EMA (Exponential) | Short-term trading | Fast response to price changes | Can produce false signals in choppy markets |
| SMA (Simple) | Long-term trend analysis | Easy to calculate and stable | Slower to react to trend shifts |
| WMA (Weighted) | Quick but smooth signals | Emphasizes recent prices more | Slightly more complex to calculate |
How to use moving averages to find the trend
Moving averages are a powerful tool for traders to determine market trends. By eliminating short-term price “noise”, they make it easy to see whether an asset is trending up, down, or sideways.
Spotting trend direction
Use a single moving average (such as a 50-day SMA or a 200-day SMA) to understand the overall direction of the market:
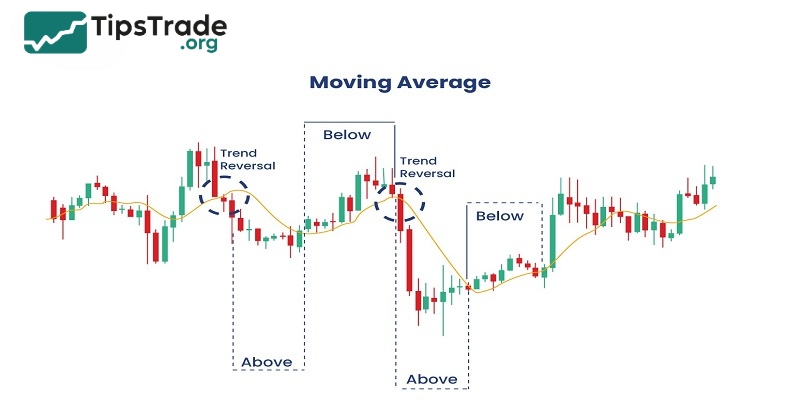
- In case the price is above the moving average, the market is likely in an uptrend.
- In case the price is below the moving average, the market is likely in a downtrend.
- In case the price fluctuates around the moving average without a clear direction, it indicates that the market is sideways or consolidating.
Slope of the moving average
The angle or slope of the moving average will help provide investors with clues about momentum of the trend:
- A rising MA = strong upward trend
- A falling MA = strong downward trend
- A flat MA = weak or no trend
Combine multiple moving averages
Using two or more moving averages simultaneously helps increase accuracy in identifying trends:
- In case the short-term MA (e.g., 20-day) crosses above the long-term MA (e.g., 50-day), it confirms the formation of a new uptrend.
- In case the short-term MA crosses below the long-term MA, it suggests a downtrend reversal.
This technique is commonly applied on longer timeframes to confirm the strength of a trend before making a decision to enter or exit a trade.
Trading strategies with moving averages
Below are some common moving average strategies that you can apply in your trading, once you’ve identified the trend using moving averages:
Moving average convergence divergence (MACD)
The MACD indicator is an effective tool, built upon EMA lines (typically EMA 12 and EMA 26). This indicator includes:
- MACD line
- Signal Line
- Histogram
Typically, to assess changes in market momentum, investors will look for the intersection between the MACD line and the signal line, while also analyzing the Histogram chart. This is a great tool for identifying entry/exit points and confirming the direction of the trend.
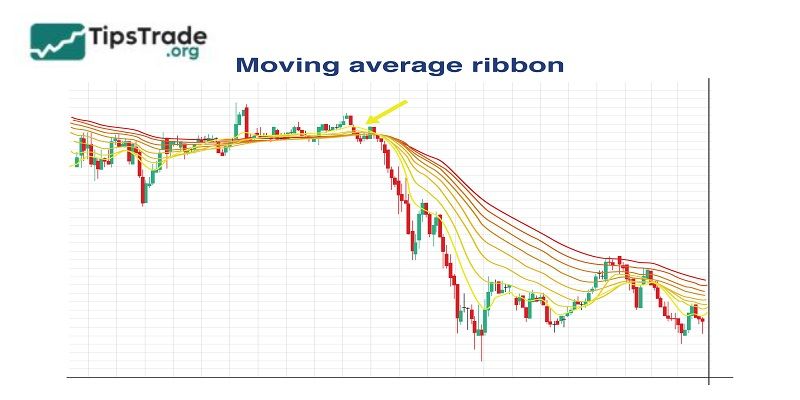
Moving average ribbon
This is a method that helps visualize market momentum and clarify price trends.
The moving average ribbon uses multiple MA lines (e.g., 8, 13, 21, 34, 55 periods) stacked on top of each other on the chart:
- If the MA ribbons are tightly packed and parallel, it indicates a strong trend.
- If the MA bands intersect or diverge, it could be a sign of a trend reversal or the formation of a new trend.
– Entry Point:
- Enter a buy (long) order when all MA bands are pointing upwards and the price corrects toward the lower MA lines.
- Enter a short position when the MA bands are pointing downwards and the price retraces to the higher MA lines.
– Stop-Loss: Place below the lowest MA band (when entering a buy order) or above the highest MA band (when entering a sell order).
– Profit Target: Hold the trend until the MA bands begin to converge or the price breaks below the lower MA band (in a buy order).
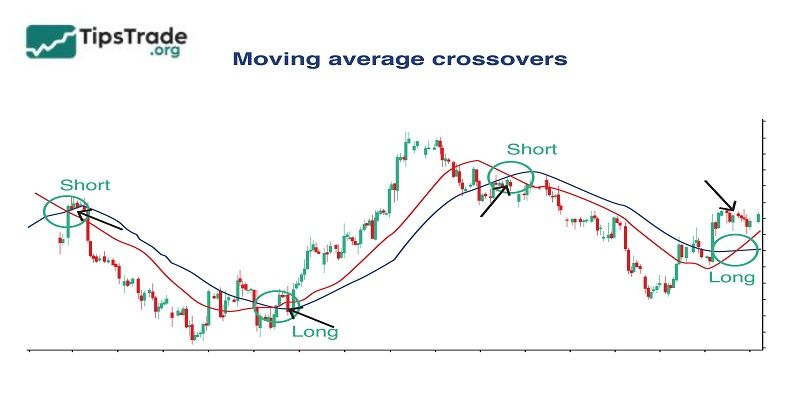
Moving average crossovers
This classic strategy uses two moving averages: a short-term and a long-term one.
- Bullish crossover: If the short-term MA (e.g., 20-day EMA) crosses above the long-term MA (e.g., 50-day SMA), it can signal the start of an uptrend.
- Bearish crossover: If the short-term MA crosses below the long-term MA, this can indicate that a downtrend is forming.
– Entry point:
- Buy when the short-term MA crosses above the long-term MA (bullish crossover).
- Sell when the short-term MA crosses below the long-term MA (bearish crossover).
– Stop-Loss: Place below the nearest bottom for buy orders, or above the nearest top for sell orders.
– Profit Target: Use a fixed risk/reward ratio (e.g., 1:2), or exit the trade when a new crossover appears in the opposite direction.
Moving average price action
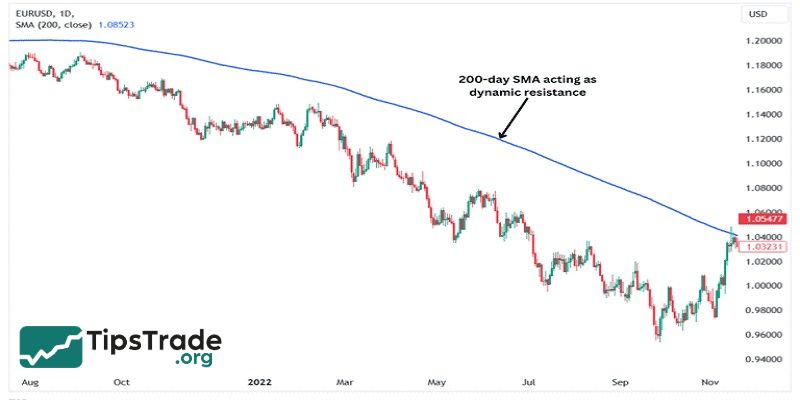
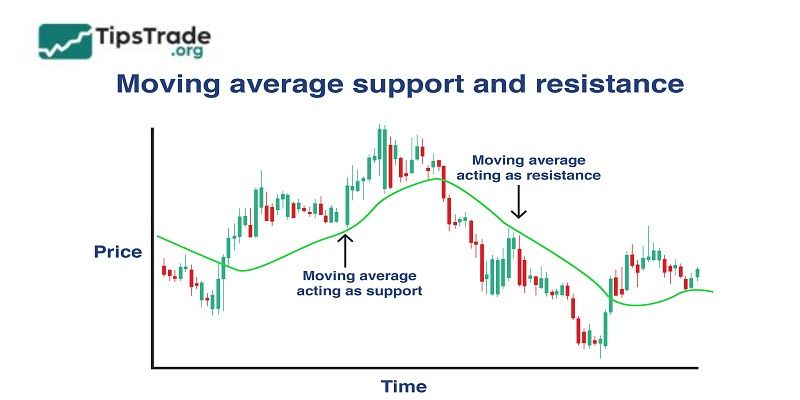
Typically, the moving average acts as dynamic support and resistance levels:
- In an uptrend, the price can bounce off the MA line, creating a buying opportunity.
- In a downtrend, the MA line can act as resistance, where the price is rejected from continuing to rise.
– Entry point:
- Enter a buy (long) order when the price retraces to the MA line in an uptrend and forms a bullish candle.
- Enter a short position when the price retraces to the MA line in a downtrend and a bearish candlestick pattern appears (e.g., a pin bar, a bearish engulfing candle).
– Stop-Loss: Place it right below the MA line (for buy orders) or right above the MA line (for sell orders).
– Profit Target: Target the nearest previous peak/trough, or use Fibonacci extensions (e.g., the 1.618 level).
Moving average with other indicators
Moving averages (MAs) are most effective when combined with other tools to confirm signals:
- Use RSI to identify overbought or oversold areas.
- Combine with Bollinger Bands to detect market volatility.
- Add volume analysis to confirm breakout phases.
This multi-indicator approach helps minimize noise and improve the quality of trading decisions.
Pros and cons of moving averages
Pros:
- Easy to use and understand
- Great for trend confirmation
- Helps filter out market noise
- Can act as support/resistance levels
- Widely used in technical analysis
- Compatible with many trading strategies
Cons:
- They’re lagging indicators, they follow price, not predict it
- False signals can happen in sideways markets
- Overreliance can be risky if not confirmed with other tools
- Need fine-tuning depending on your timeframe and asset
Final thoughts
The above is all the detailed information about moving averages that we wanted to share with you. Tipstrade.org hopes the above information will help you feel more confident in your investment decisions. And be sure to follow Tipstrade.org every day for more useful investment knowledge updates!