
Support and resistance are among the most essential concepts in technical analysis, shaping how traders interpret market behavior and forecast potential price movement. Whether in forex, gold, stocks, or cryptocurrencies, these price zones represent psychological and structural turning points in the market. New traders often see the market as random and unpredictable, yet price frequently reacts at the same areas over and over again. Support and resistance explain why. Visit tipstrade.org and check out the article below for further information
What Are Support and Resistance?
Definition of Support and Its Role in Market Structure
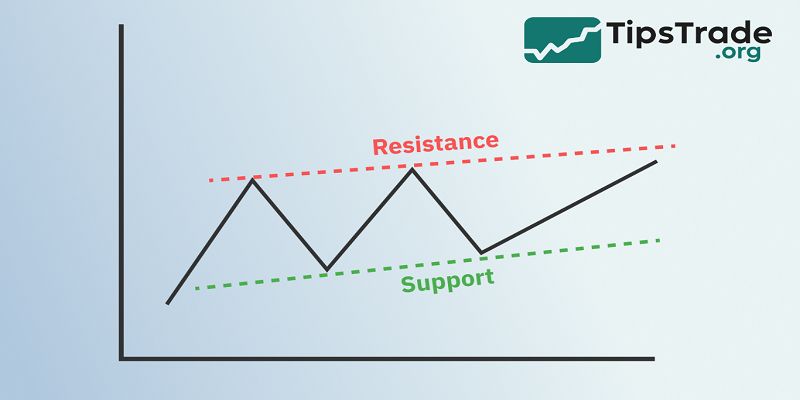
Support is a price level where demand outweighs supply, causing a falling market to pause or reverse. When traders see value in a declining asset, buying volume increases, preventing further decline. These levels can emerge from institutional orders, retail investor reaction, or psychological round numbers like 1.0500 in EUR/USD or 20,000 in Bitcoin. According to a 2024 report from CME Group, large order clusters often form at historical lows, reinforcing support levels. In practice, support shows where buyers previously protected the market.
When price revisits that zone, traders expect a similar reaction. For example, if Apple stock repeatedly bounces around $150, analysts identify $150 as a strong support. However, support is not guaranteed; if price breaks decisively below it, the broken support frequently turns into new resistance. This behavior reflects market sentiment shifting from bullish to bearish.
Definition of Resistance and Why It Matters
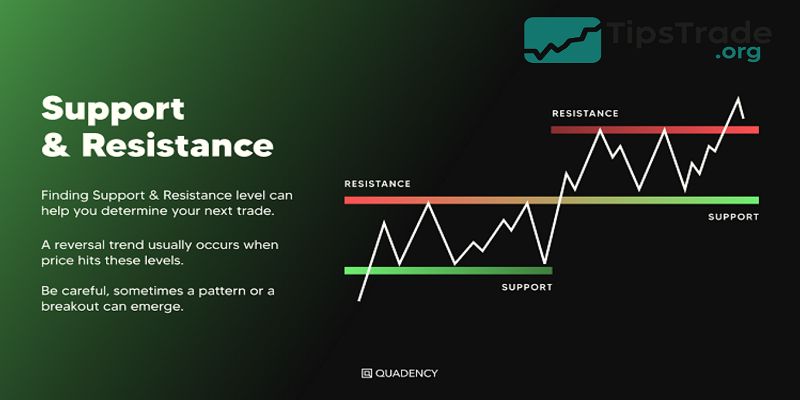
Resistance is the opposite: a level where selling pressure exceeds buying power. When price climbs into a resistance zone, traders may take profit, institutions reduce exposure, or algorithms detect overbought conditions. Common resistance examples include previous swing highs, Fibonacci retracement levels, or key moving averages. As noted by analysts at IG Markets, resistance often forms around psychological milestones, such as the Dow Jones approaching round numbers like 40,000.
Resistance helps traders avoid buying at expensive prices and prepares them for potential pullbacks. When resistance is broken, it often signals strong momentum. Successful breakouts usually attract higher volume, institutional confirmation, and emotional acceleration from retail traders. Similar to support, once resistance is broken, it can turn into newly formed support during a retest.
Why Support and Resistance Remain Core to Technical Analysis
Support and resistance are universal across all chart types and timeframes. Price can respect these zones whether traders look at M15, H1, H4, or Daily charts. The reason is psychological: humans respond to repeated price ranges. Financial researchers from the Journal of Behavioral Finance found that traders tend to anchor decisions to historical prices, increasing reaction near familiar levels.
S/R works well with price action, candlestick patterns, volume analysis, and indicators. It is simple, visual, and effective even for new traders. Professional analysts at banks and hedge funds also track S/R to coordinate entries and exits, proving that institutional and retail behavior overlap.
How to Identify Support and Resistance Accurately
Using Historical Highs and Lows
The simplest method to identify S/R is by marking previous swing highs and lows on the chart.
Markets frequently return to these levels because traders remember where price historically reversed.
If gold repeatedly bounces around $1,920, that level becomes a crucial support zone. If Bitcoin struggles near $70,000, that area becomes key resistance.
The more times price touches a level without breaking it, the stronger the zone becomes.
Traders look for:
- Multiple touches with strong reaction
- High volume near the zone
- Long wicks showing rejection
- Sharp movement away from the level
Historical S/R appears in all liquid markets, from stocks like Tesla to currency pairs like USD/JPY. Even automated trading systems incorporate S/R data into execution models to optimize entries.
Using Trendlines for Dynamic S/R
- While historical highs and lows create static levels, trendlines create dynamic support and resistance. In an uptrend, rising swing lows form an ascending support trendline.
- In a downtrend, lower swing highs create descending resistance.
- Traders use trendlines to understand directional bias and market structure.
- For example, if NASDAQ tracks an upward trendline for weeks, institutional traders view every retest as an opportunity to buy risk assets.
- When that trendline finally breaks, selling pressure increases sharply.
- Dynamic trendlines are especially useful during trending markets but weaker in sideways consolidation.
Moving Averages, Fibonacci, and Bollinger Bands
Indicators often act as dynamic support and resistance. Common examples include:
| Indicator | Type | How It Acts as S/R |
| 50 & 200 MA | Dynamic | Support in uptrend, resistance in downtrend |
| Fibonacci retracement | Static | 0.382, 0.5, 0.618 levels commonly respected |
| Bollinger Bands | Dynamic | Price reversal when touching upper/lower band |
A well-known pattern occurs when price pulls back to the 50-day or 200-day moving average. According to research from Fidelity Investments, long-term moving averages attract significant institutional volume, making them powerful S/R zones in stocks and indices.
Static vs. Dynamic Support and Resistance
- Static S/R comes from historical structure—previous highs, lows, or horizontal zones. Dynamic S/R is created by trendlines, moving averages, and volatility bands.
- Many professional traders combine both approaches.
- For example, if the EUR/USD falls into a historical support zone that aligns with the 200-day moving average, the probability of a bounce increases.
- Static is stronger in ranging markets, while dynamic works better during trends. Understanding both prevents traders from relying on only one tool.
How to Trade Using Support and Resistance
Buy at Support, Sell at Resistance
- This is the most common approach. Traders buy where price historically finds support, expecting a bounce, and sell near resistance, anticipating a pullback.
- Price action confirmation, such as bullish engulfing candles, hammer wicks, or high volume near support, strengthens the setup.
Example:
- Gold drops to $2,000 — a psychological support level
- Buyers rush in, creating a strong bullish candle
- Traders enter long, place stop-loss below the wick, and target previous resistance like $2,050
This strategy works well on higher timeframes because noise is reduced and S/R zones are respected more consistently.
Breakout and Retest Strategy
- Breakouts happen when price decisively breaches a strong S/R level. However, fake breakouts are common, especially in crypto and forex.
- Therefore, many professional traders wait for a retest.
- For example, if Bitcoin breaks above $70,000, traders wait for price to pull back and test $70,000 as new support. If volume increases and price holds, the breakout is confirmed.
- Retest entries help reduce risk because traders avoid buying at the top of the breakout candle.
- According to trading educators at Babypips, breakout-retest strategies reduce false entry rates by filtering out impulse wicks.
Stop-Loss and Take-Profit Management
Risk management is essential. Traders often place stop-loss orders slightly below support when buying or slightly above resistance when selling. Take-profit levels are usually set at the next logical S/R zone. A structured S/R plan reduces emotional trading and overconfidence.
For example:
- Entry: long EUR/USD at 1.0500 support
- Stop-loss: below 1.0475
- Take profit: at resistance 1.0600
This creates a favorable reward-to-risk ratio. Without clear exits, traders often hold losing positions, hoping for reversals.
Using S/R in Forex, Gold, Stocks, and Crypto (H3)
Support and resistance apply across all markets:
- Forex reacts strongly to economic news around S/R levels.
- Gold respects psychological zones because of safe-haven investor behavior.
- Stocks respect earnings gaps, volume profiles, and institutional order blocks.
- Crypto reacts emotionally, often overshooting S/R levels before reversing.
No matter the market, liquidity concentrates at these zones. High liquidity means tighter spreads, strong reactions, and cleaner patterns.
Real Chart Examples
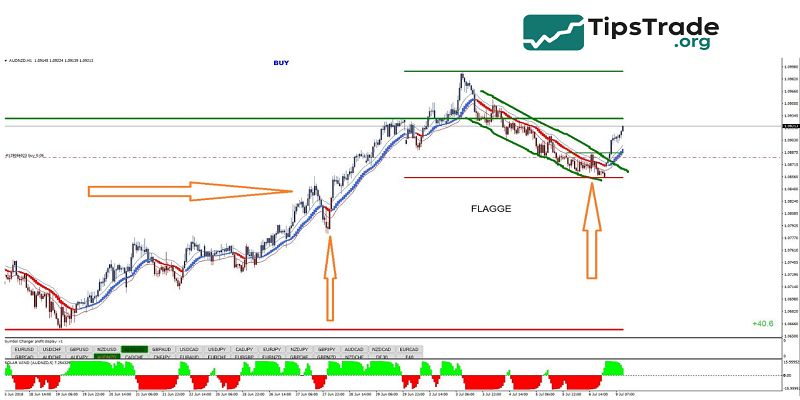
EUR/USD Reaction Zones
- EUR/USD frequently respects levels like 1.0500 and 1.1000 due to central bank influence.
- Traders watch these zones closely after ECB and Fed announcements.
- During 2023–2024, every time EUR/USD fell toward 1.0500, buyers stepped in repeatedly.
- Charts show long wicks and rising volume at that price, confirming demand.
Gold (XAU/USD)
- Gold often bounces at round psychological levels: $1,850, $1,900, $2,000.
- These levels attract hedge funds, central banks, and retail trading algorithms.
- Breakouts above $2,000 typically create sharp rallies because traders interpret that level as symbolic.
- When gold corrected to $1,920, strong support emerged due to a combination of historical structure and Fibonacci confluence.
Bitcoin and Crypto Volatility
- Crypto assets react violently around S/R zones, often spiking above resistance to trap buyers.
- Bitcoin’s previous all-time highs — $20,000 in 2017, $69,000 in 2021 — later turned into long-term support levels.
- Crypto traders often wait for daily closes rather than small timeframes to confirm true breakouts.
Common Mistakes Traders Make With S/R
Drawing Too Many Levels
- Beginners clutter charts with dozens of lines, creating confusion and decision fatigue.
- Professional analysts recommend focusing on major zones that caused strong moves, less is more.
- Remove noise and track only the zones with high historical impact.
Ignoring Dynamic S/R
- Traders who only use static zones may miss trendline or moving-average confluence.
- When dynamic and static levels meet, reactions are stronger.
- Ignoring dynamic S/R reduces accuracy and increases uncertainty during trending markets.
Not Waiting for Confirmation
Jumping into trades before confirmation creates losses. Fake breakouts frequently trap emotional traders. Patience improves win-rate. Confirmation can include:
- Candle rejection
- Divergence
- Volume spike
- Retest of broken level
Tools and Indicators That Help Identify S/R
Trading View Automation Tools
- Trading View offers indicators that automatically detect S/R zones.
- They reduce manual error and help beginners visualize key levels.
- Alerts notify traders when price approaches these zones.
Fibonacci Retracement
- Fibonacci levels such as 0.382, 0.5, and 0.618 are widely respected in forex and crypto.
- Analysts from Daily FX note that traders often combine Fibonacci with support or resistance to enhance accuracy.
- When a retracement aligns with a previous support, probability of reversal increases.
Volume Profile (H3)
- Volume Profile shows where trading volume concentrated historically.
- High-volume nodes act as support; low-volume areas behave like gaps.
- Institutional traders rely heavily on volume analysis to position themselves.
Chart Patterns Built on S/R
Double Top and Double Bottom
- These patterns rely on S/R rejection. A double bottom forms when price tests support twice and fails to break.
- A double top is the opposite, signaling resistance strength.
- They help traders anticipate reversal.
Head and Shoulders
This pattern combines structure, volume, and S/R. The neckline acts as major support. When broken, trend reversal often accelerates. Analysts at Investopedia describe it as one of the most reliable price-action patterns.
Supply and Demand Zones
- Advanced traders focus not just on price lines but on entire zones.
- Supply zones create resistance; demand zones create support.
- These zones reflect institutional liquidity.
Conclusion
Support and resistance remain a timeless foundation of technical analysis. They simplify market complexity into understandable levels of supply, demand, and psychology. Financial institutions, retail traders, and algorithmic systems all rely on these zones for trade execution.