
Volume trading is one of the most powerful methods traders use to understand market behavior and identify potential price movements. By analyzing trading volume, investors can gain valuable insights into the strength of trends, market sentiment, and possible reversals. In this article, Tipstrade.org will help you answer the question: What is volume trading? In addition, we will also introduce proven effective volume trading strategies. Let’s get started!
What is volume trading?
Volume trading, also known as volume of trade, is a technical analysis method based on observing and evaluating the trading volume of a financial asset, such as stocks, gold, cryptocurrencies, or foreign exchange.
Volume here represents the total number of contracts or trading orders executed within a specific time period (e.g., within a 1-hour, 4-hour, or 1-day candlestick).
In other words, volume indicates the level of interest and the strength of the cash flow behind price movements. When volume is high, it means many investors are participating, the market is active, and trend signals become more reliable. Conversely, low volume indicates a lack of interest or a period of market accumulation.
Example of volume trading
For example, if a stock’s price rises while trading volume also increases, it indicates strong market support. On the other hand, if the price falls while volume rises, it could suggest increasing selling pressure. This method is often used alongside other forms of analysis, such as technical analysis.
How does volume trading work?
Explaining the mechanics of volume trading are not too complicated: volume trading is compared with price movements to identify patterns and signals. Traders observe whether volume moves in the same direction or against price.
A trend is considered strong when volume increases along with the price increase. Conversely, if a downtrend is accompanied by high volume, it shows that the selling pressure is supported by many investors in the market. Divergence, meaning when the price increases but the volume decreases, can be a sign that the trend is weakening.

Volume also plays an important role in analyzing trend reversals and breakouts. A significant increase in volume during a breakout usually confirms that the move is driven by strong overall market activity. However, low volume may indicate that the breakout is not sustainable. Understanding the relationship between volume and price movement helps traders make more accurate decisions and better interpret market patterns.
Common indicators in volume trading
Volume trading indicators are tools that help traders analyze volume and price movements more effectively. They convert complex data into easier-to-understand visual or numerical signals. These indicators show the relationship between volume and the price action of an asset, and provide insight into the trend, reversal point, or strength of the market.
Below are common indicators in volume trading that you should know:
On balance volume (OBV)
The On Balance Volume (OBV) indicator helps traders track the flow of capital into or out of an asset. OBV is calculated by adding the trading volume on days when the price increases and subtracting the volume on days when the price decreases.
When OBV increases, it indicates that capital is flowing into the market, signaling the potential for prices to continue rising. Conversely, when OBV decreases, it indicates capital is flowing out and the market may be weakening.

Klinger volume oscillator (KVO)
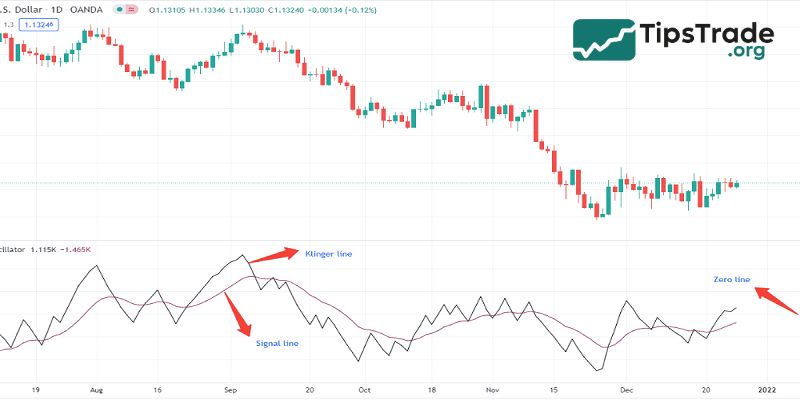
The Klinger Volume Oscillator (KVO) indicator helps traders identify long-term trends as well as short-term reversal points in the market. This indicator combines price volatility and volume data to show the balance between buying and selling pressure.
A positive value indicates stronger buying pressure, while a negative value suggests selling pressure is dominant. KVO is often used to detect potential trend reversal signals early.
Accumulation/Distribution indicator
The Accumulation/Distribution (A/D) indicator is a useful tool for traders to assess the underlying strength of the market. It links trading volume to the closing price position within the daily trading range.
When the closing price is near the highest level of the day, it indicates “accumulation,” while when the closing price is near the lowest level of the day, it suggests “distribution.” This allows traders to determine which side (buyers or sellers) is dominating the market.

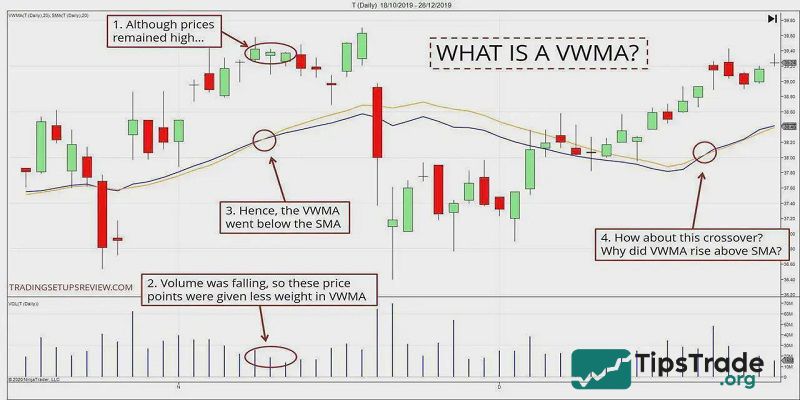
Volume weighted moving average (VWMA)
The Volume Weighted Moving Average (VWMA) considers trading volume in its calculation, thereby assigning greater weight to periods with high trading activity. This helps to more accurately reflect market activity compared to simple moving averages (SMAs). Traders often use VWMA to assess trends and determine whether price movements are supported by large trading volumes.
Chaikin money flow (CMF)
The Chaikin Money Flow (CMF) indicator measures the actual amount of capital flowing into or out of the market. It combines price and volume data to generate positive or negative values.
A positive value indicates buying pressure, while a negative value signifies selling pressure. CMF is often used to confirm the strength of the current trend or to detect early signs of weakening.

Volume profile and volume indicator
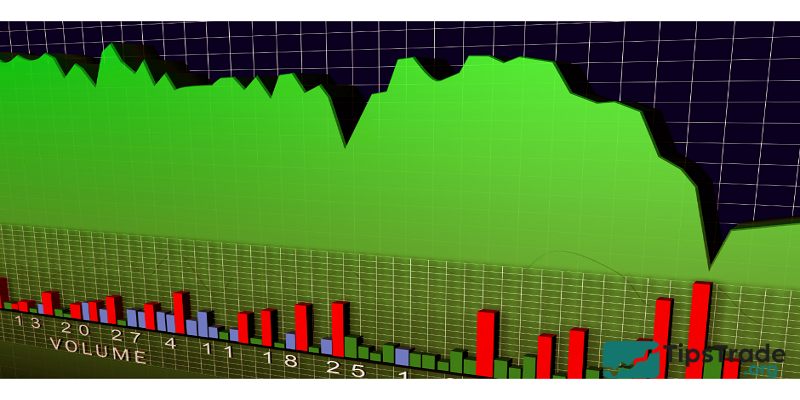
The Volume Profile chart displays trading volume at different price levels, helping users identify areas of strong trading activity and determine key support and resistance zones.
Additionally, the basic volume indicator provides an overview of trading activity, often represented as a bar chart showing volume for each price movement.

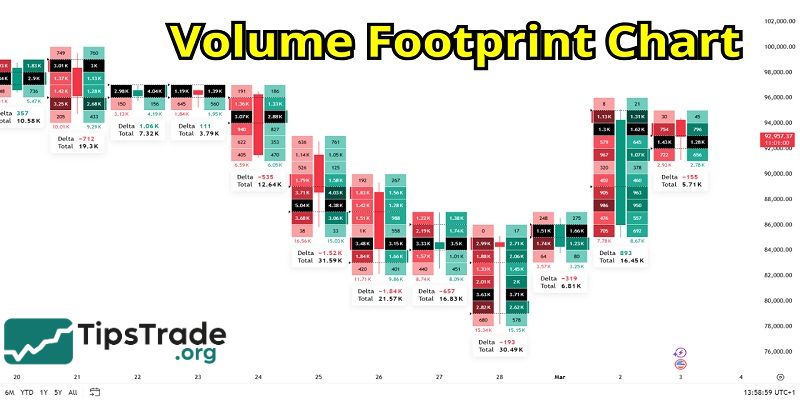
Footprint chart
A more detailed volume analysis tool is the Footprint chart. It displays the number of buy and sell orders executed at each specific price level, providing insights into market activity. This tool is particularly useful in understanding supply and demand dynamics at the micro level, thereby assisting traders in making more accurate decisions.
Volume trading strategies
To analyze market volatility and make informed investment decisions, volume trading can be used in various ways. Both short-term traders like day traders and long-term investors can benefit from volume analysis. The key lies in how you interpret volume in conjunction with other factors to build a strategy that aligns with your investment goals and time horizon.
Below’s a detailed analysis of the approach in both the short and long term:
Short-term strategies: Day trading and scalping
Uses of volume in short-term trading strategies like day trading or scalping is to help traders make quick decisions in a highly volatile market environment. Traders are focusing on:
- High-volume breakouts: An increase in volume during a breakout phase often indicates that the price trend may be sustainable.
- Trend reversals: The surge in volume combined with the reversal signal suggests a high probability that the trend is changing direction.
- Divergences: When volume decreases while price increases, this signals that the current trend is weakening.
Long-term strategies: Trend following and position building
Long-term traders use volume analysis to identify sustainable trends and market movement phases for assets such as stocks. Some important approaches include:
- Confirming long-term trends: A stable trend accompanied by high volume indicates strong market sentiment.
- Support and resistance levels: High trading volume often marks important price zones.
- Accumulation and distribution phases: The volume model helps identify whether investors are buying or selling assets.
Effective tools for volume trading
Appropriate tools play a crucial role in effectively analyzing volume data and integrating it into trading strategies. Some of the most important tools include:
- Charting software: Enables detailed analysis of volume and price movements.
- Volume indicators: Built-in indicators like OBV, VWMA, and CMF help visualise volume patterns.
- Footprint charts: Provide detailed insights into volume at specific price levels.
- Volume Profile: Shows where the highest trading volume occurs, helping to identify support and resistance levels.
- Demo accounts: Ideal for beginners to test strategies and practise volume analysis before investing real capital.
Advantages and disadvantages of volume trading
Just like any other trading method, volume trading has notable advantages that make it easier for investors to grasp trends, but it also has some limitations that need to be considered when applying it in practice. Understanding your strengths and weaknesses will help you use this method more effectively and accurately.
Advantages of volume trading
- Provides additional insights into market dynamics and improves asset analysis
- Can indicate trend reversals early, optimising decision-making
- Helps identify support and resistance levels in charts
- Works well alongside other analysis methods, such as technical analysis
- Allows beginners to learn risk-free using demo accounts
Disadvantages of volume trading
- Requires a learning curve to interpret volume data correctly
- May produce less reliable signals in low-volume markets
- Relies on access to appropriate trading software and data
- Can lead to poor decisions if not understood properly
- Not every volume signal is meaningful, requiring experience and practice.
Final thoughts
Mastering the volume trading strategies presented above will equip you with a powerful toolkit for making more informed trading decisions. Don’t just look at the price; start paying attention to trading volume to better understand the real market sentiment and money flow. Wishing you successful trading!